Download
1 / 22
230 likes | 427 Vues
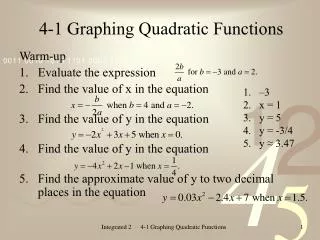
1 .1 Graphing Quadratic Functions (p. 249). Definitions Standard form of quad. function Steps for graphing Minimums and maximums. Quadratic Function. A function of the form y=ax 2 +bx+c where a ≠0 making a u-shaped graph called a parabola. Example quadratic equation:. Vertex-.

E N D
1.1 Graphing Quadratic Functions(p. 249) • Definitions • Standard form of quad. function • Steps for graphing • Minimums and maximums
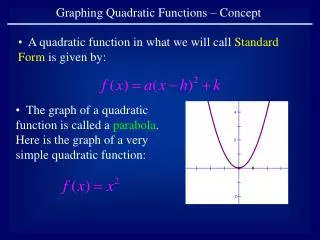
Quadratic Function • A function of the form y=ax2+bx+c where a≠0 making a u-shaped graph called a parabola. Example quadratic equation:
Vertex- • The lowest or highest point of a parabola . This is the maximum or minimum of the graph. Vertex Axis of symmetry- • The vertical line through the vertex of the parabola. Axis of Symmetry
Standard Form Equation y=ax2 + bx + c • If a is positive, u opens up If a is negative, u opens down • The x-coordinate of the vertex is at • To find the y-coordinate of the vertex, plug the x-coordinate into the given eqn. • The axis of symmetry is the vertical line x= • Choose 2 x-values on either side of the vertex x-coordinate. Use the eqn to find the corresponding y-values. • Graph and label the 5 points and axis of symmetry on a coordinate plane. Connect the points with a smooth curve.
Example 1 Graph a function of the form y = ax2 Graphy = 2x 2. Compare the graph with the graph ofy = x 2. SOLUTION STEP 1 STEP 2 Plot the points from the table. STEP 3 Draw a smooth curve through the points.
Graph a function of the form y = ax 2 STEP 4 Compare the graphs of y = 2x 2and y = x 2. Both open up and have the same vertex and axis of symmetry. The graph of y = 2x 2 is narrower than the graph of y = x 2.
x 2 + 3 12 Make a table of values for y = – Example 2: Graph a function of the form y = ax 2 + c graph of y = x 2 SOLUTION STEP 1 STEP 2 Plot the points from the table. STEP 3 Draw a smooth curve through the points.
x 2 + 3 12 Example 2 continued STEP 4
Practice y = – x 2 – 5 SOLUTION STEP 1 Make a table of values fory = – x 2 – 5. STEP 2 Plot the points from the table. STEP 3 Draw a smooth curve through the points. STEP 4 Compare the graphs of y = – x 2 – 5 and y = x 2.
ANSWER Practice Answer Same axis of symmetry, vertex is shifted down 5 units, and opens down
Example 3: Graph y=2x2-8x+6 • Axis of symmetry is the vertical line x=2 • Table of values for other points: x y • 0 6 • 1 0 • 2 -2 • 3 0 • 4 6 • * Graph! • a=2 Since a is positive the parabola will open up. • Vertex: use b=-8 and a=2 Vertex is: (2,-2) x=2
Now you try one!y=x2−2x−1* Open up or down?* Vertex?* Axis of symmetry?
(– 2) 2(1) b 2a – x = = 1 = Graph the function. Label the vertex and axis of symmetry. y = x 2 – 2x – 1 SOLUTION STEP 1 Identify the coefficients of the function. The coefficients are a = 1, b = – 2, and c = – 1. Because a > 0, the parabola opens up. Then find the y- coordinate of the vertex. STEP 2 Find the vertex. Calculate the x - coordinate. y = 12 – 2 • 1 + 1 = – 2
Practice answer So, the vertex is (1, – 2). Plot this point. Draw the axis of symmetry x = 1. STEP 3 STEP 4 Select the point to the right or the left of the axis of symmetry (right=2, left = 0) to find another point to plot. Then plot the symmetrical point.
(– 18) 2a x = − = – b 2a ANSWER The minimum value is y = –7. You can check the answer on a graphing calculator. Find the minimum or maximum value Tell whether the function y = 3x 2 – 18x + 20 has a minimum value or a maximum value. Then find the minimum or maximum value. SOLUTION Because a > 0, the function has a minimum value. To find it, calculate the coordinates of the vertex. = 3 y = 3(3)2– 18(3) + 20 = –7
A go-cart track has about 380 racers per week and charges each racer $35 to race. The owner estimates that there will be 20 more racers per week for every $1 reduction in the price per racer. How can the owner of the go-cart track maximize weekly revenue ? Solve a multi-step problem Go - Carts
320 2(– 20) x = – = – b 2a SOLUTION Define the variables. Let xrepresent the price reduction and R(x) represent the weekly revenue. STEP 1 Write a verbal model. Then write and simplify a quadratic function. STEP 2 R(x) = 13,300 + 700x – 380x – 20x 2 R(x) = – 20x 2 + 320x + 13,300 STEP 3 Find the coordinates (x, R(x)) of the vertex. = 8 Find x- coordinate. Evaluate R(8). R(8) = – 20(8)2 + 320(8) + 13,300 = 14,580
ANSWER The vertex is (8, 14,580), which means the owner should reduce the price per racer by $8 to increase the weekly revenue to $14,580.
What If ?In Example 5, suppose each $1 reduction in the price per racer brings in 40 more racers per week. How can weekly revenue be maximized? SOLUTION Define the variables. Let xrepresent the price reduction and R(x) represent the weekly revenue. STEP 1 Write a verbal model. Then write and simplify a quadratic function. STEP 2 R(x) = – 20x 2 + 1020x + 13,300
ANSWER The vertex is (12.75, 19,802.5), which means the owner should reduce the price per racer by $12.75 to increase the weekly revenue to $19,802.50. Find the coordinates (x, R(x)) of the vertex. STEP 3 Find x- coordinate. Then, evaluate R(12.75). R(12.75) = – 40(12.75) + 1020(12.75) + 13,300 = 19802.5
Assignment p. 6 8-16 even, 19 & 20, 22-30 even, 55 & 56 For graphing problems: Does the function have a max or min?