Download
1 / 53
550 likes | 771 Vues
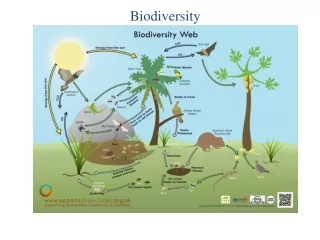
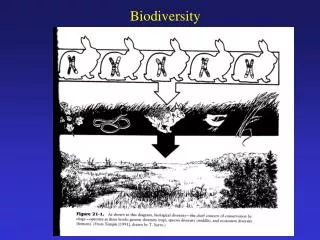
Biodiversity. Why is Biodiversity Important?. Genetic diversity:. Why is Biodiversity Important?. Species Diversity:. Why is Biodiversity Important?. Ecosystem Diversity:. Diversity = Richness + Evenness. richness : count of # species evenness : relative abundance of species.

E N D
Why is Biodiversity Important? • Genetic diversity:
Why is Biodiversity Important? • Species Diversity:
Why is Biodiversity Important? • Ecosystem Diversity:
Diversity = Richness + Evenness • richness: count of # species • evenness: relative abundance of species Ecosystem AEcosystem B 4 oak species 3 oak species bl oak = 40 bl oak = 120 wh oak = 30 wh oak = 60 r oak = 20 r oak = 20 pin oak = 10 pin oak = 0
Three Scales of Diversity A = B = alpha () diversity – within habitat C = beta () diversity – among habitat D = gamma () diversity – geographic scale
Alpha & Gamma Species Diversity Indices • Shannon-Wiener Index – most used • sensitive to change in status of rare species • H’ = diversity of species (range 0-1+) • s = # of species • pi = proportion of total sample belonging to ith species
Alpha & Gamma Species Diversity Indices • Shannon-Wiener Index
Alpha & Gamma Species Diversity Indices • Simpson Index – sensitive to changes in most abundant species • D = diversity of species (range 0-1) • s = # of species • pi = proportion of total sample belonging to ith species
Alpha & Gamma Species Diversity Indices • Simpson Index
Alpha & Gamma Species Diversity Indices • Species Evenness • H’max = maximum value of H’ = ln(s)
Beta Species Diversity Indices • Sorensen’s Coefficient of Community Similarity – weights species in common • Ss = coefficient of similarity • (range 0-1) • a = # species common to both samples • b = # species in sample 1 • c = # species in sample 2
Beta Species Diversity Indices • Sorensen’s Coefficient of Community Similarity • Dissimilarity = DS = b + c / 2a + b + c • Or 1.0 - Ss
Sorensen’s Coefficient • Sample 1 • Total occurrences = b = 7 • # joint occurrences = a = 5 • Sample 2 • Total occurrences = c = 5 • # joint occurrences = a = 5 • Ss = 2 * 5 / 10 + 7 + 5 = 0.45 (45%) • Ds = 1 – 0.45 = 0.55 (55%)
Species-of-the-Week • American woodcock (Scolopax minor)
Habitat • Woods & thickets with moist soil, small openings near woody cover • aspen, alder, willow cover types (early successional = seedling/sapling stage; <3 in dbh)
Food • Diet = 50-90% earthworms • Diurnal foraging in spring/summer • Nocturnal foraging in winter • Long bill used as probe (foot stomping)
Reproduction • Courtship behavior = males on breeding fields Mar-Apr -- polygynous • Clutch size = ~4 eggs • I.P. = 21 days; near full grown in 28 days • Behavior • Migratory – winters in SE U.S. • Nonvocal calls = wing position
Estimating Abundance of Wildlife • Terms • Population • Relative vs. Absolute Abundance • Parameter vs. Statistic • Population Index • Accuracy • Precision • Bias
Estimating Abundance of Wildlife • Complete Counts (Census) • open habitat = visible wildlife • concentration of activity • small study area
Estimating Abundance of Wildlife • Complete Counts (Census) • Drives • * Biased (under- or overestimate) • Territorial (Spot) Mapping • e.g., breeding birds
Limitations: • territorial species (grouse, songbirds) • sex ratio known or assumed • nonterritorial males? (floaters) • ability to id species & map territories • Territorial (Spot) Mapping
Estimating Abundance of Wildlife • Complete Counts (Census) • Aerial Counts & Sensing • - must see animal to count it! • - Aerial Photos or IR Thermal Scans • photos of migratory waterfowl
Estimating Abundance of Wildlife • Complete Counts (Census) • Aerial Counts & Sensing • Aerial line-transect counts • must see animal to count it! • Aerial Photos or IR Thermal Scans • photos of migratory waterfowl • IR scans of wildlife (bowhunting study in MN – loss rate)
Estimating Abundance of Wildlife • Complete Counts - Sample Plots • Line transects (ground or aerial) • e.g., flush count for grassland birds • assumes 100% detection
Indices of Relative Abundance • …dependent on the collection of samples that represent some relatively constant but unknown population size • Traps, number of fecal pellets, vocalization frequency, pelt records, catch/unit effort, number of artifacts, questionnaires, cover, feeding capacity, roadside counts
Spatial Organization Female Male