Download
1 / 29
290 likes | 417 Vues
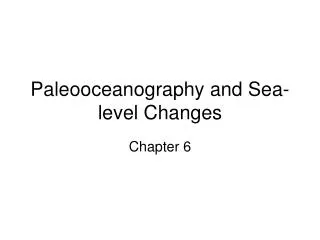
Chapter 4: The Changing Level of the Sea. Tides Longer Scale Variations Influence on Beaches. Tide - rhythmic oscillation of the ocean surface due to gravitational & centrifugal forces (‘inertia’) between the Earth, Moon and Sun.

E N D
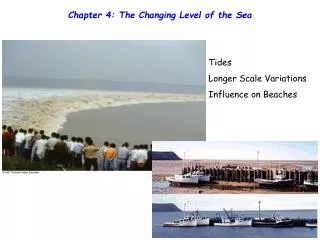
Chapter 4: The Changing Level of the Sea Tides Longer Scale Variations Influence on Beaches
Tide - rhythmic oscillation of the ocean surface due to gravitational & centrifugal forces (‘inertia’) between the Earth, Moon and Sun. Tide Patterns - regular, cyclic patterns of low water-high water Tidal cycle – one low tide and one high tide consecutively diurnal tide - one low tide, one high tide a day; semidiurnal tide - high water-low water sequence twice a day; 2 high, 2 low, about the same level semidiurnal mixed tide - same as semidiurnal but 2 highs and 2 lows do not reach/drop to the same level; may be the result of a combination of tide types
diurnal tide semidiurnal tide semidiurnal mixed tide Tide Patterns - regular, cyclic patterns of low water-high water
Semidiurnal tides Diurnal tides Mixed tides d (ft) (m) Mixed tide, Los Angeles Diurnal tide, Mobile, Alabama Semidiurnal tide, Cape Cod 14 4 Higher high tide 10 3 High tide Lower high tide High tide 6 2 4 1 0 0 Lower low tide Higher low tide –4 –1 Low tide Low tide 0 6 12 18 24 30 0 6 12 18 24 30 36 42 48 0 6 12 18 24 30 36 42 48 36 42 48 a Time (hr) b Time (hr) c Time (hr) Most of the world’s ocean coasts have semidiurnal tides.
Flood Tide: tide wave is propagating (onto shore) onshore – water level is rising High Tide: water level reaches highest point Ebb Tide: tide is moving out to sea – water level is dropping Low Tide: water level reaches lowest point Slack tide: period when tide wave is reversing – low current velocity Water currents are generated by the tides, the speed of the incoming tide is about the same but in the opposite direction of the outgoing tide. Moving waters have to slow down and reverse, from flood to ebb and vice versa (slack tide). This is a good time for navigation through narrow places, particularly those characterized by strong tides (East River, for example).
Mean Tide Level = MTL - computed from measurements taken at a place over many years and averaging all water levels. Mean High-Water = MHW. Mean Low-Water = MLW. For mixed tides: Mean Higher High Water = MHHW Mean Lower Low Water = MLLW tidal range– difference between MHW and MLW (water level at high tide and water level at low tide)
Study of Tides • Equilibrium Tidal Theory - ideal approach to understand basic principles, assumes an earth covered with water • Assumptions: • 1: entire Earth surface covered in water • 2: infinitely deep basin (no shoaling) • 3: tidal bulge fixed relative to the moon • Dynamical Tidal Analysis - realistic approach, studying the tides as they occur on earth, accounts for modification due to landmasses, geometry of ocean basins, earth’s rotation. Tides are caused by the difference in gravitational forces resulting from the change of position of the Sun and the Moon relative to points on Earth
universal law of gravitation F= G m1 m2 / R2 G = universal gravitational constant m1, m2 = mass of bodies R = distance between centers of mass of bodies B & C = gravitational forces
Centripetal force is a force that makes a body follow a curved path; it is always directed orthogonal to the velocity of the body, toward the instantaneous center of curvature of the path. The term centripetal force comes from the Latin words centrum ("center") and petere ("tend towards", "aim at"), signifying that the force is directed inward toward the center of curvature of the path.
Nowhere on Earth’s surface will the force of attraction by the Moon be exactly equal in magnitude and direction to the centripetal force (F = Gmmme/R2). The difference between these forces at any point provides the net force that is responsible for tide generation on Earth.
1,650 km (1,023 mi) Earth’s mass is 81 times the mass of the moon Moon (81/82) r (1/82) r Average Earth–moon distance (r) The tide producing force creates two tidal bulges, one toward the moon and the other directed away from the moon.
(with figures 11.5 & 11.6 in textbook) The Tide Producing Force (difference between gravitational forces and centrifugal forces at the earth surface) is proportional to GM/R3
The Tidal Day = 24 hr 50 min Lunar Cycle: the Earth – Moon system has a period of 29.5 days Diurnal = 24 hr 50 min Semidiurnal = 12 hr 25 min
The Sun Tide Spring & Neap Tides
Dynamic Tidal Analysis (Pierre-Simon Laplace) A mathematical study of tides as they occur. It looks at the tide wave, which is similar to the tide wave of the ideal water covered earth, but varies from place to place. * Continents break up wave propagation * Tide wave moves continuously around the globe only in the Southern Ocean (Antarctica). * shallow-water wave: speed is controlled by depth of ocean * standing wave: oscillates because it is contained in ocean basins (wave ‘contained’ in ocean basin) * reflected by continents, refracted by changes in depth, and diffracted (spread of energy sideways) as it passes through gaps * Coriolis affects the water movement because it is a large scale phenomenon.
Amplitude -- One-half the range of a tidal constituent. Amplitudes are in Feet Phases are in degrees, referenced to Local Z0 (MLLW): 0 Feet Name Amp Period (solar hours) M2 2.189 12.42 Main lunar semidiurnal S2 0.420 12.00 Main solar semidiurnal N2 0.507 12.66 Lunar constituent due to monthly variation in the Moon’s distance K1 0.333 23.93 Solar-Lunar constituent O1 0.169 25.82 Main lunar diurnal constituent
Ocean Basin Natural Period of Resonance Lb = length of the basin h = water depth If the natural period corresponds to the periodicity of the tide-generating force there will be a resonant condition and the amplitude of the standing wave will increase.
Defant (1958): Form of the tide can be characterized by the relative magnitudes of the tidal constituents M2, S2, K1 and O1 Nf = 0-0.25 semidiurnal form Nf = 0.25-1.5 mixed, predominately semidiurnal Nf = 1.5-3.0 mixed, predominately diurnal Nf >3.0 diurnal form
Davies (1964): classification based on spring tidal ranges Microtidal: less than 2m Mesotidal: 2-4 m Macrotidal: greater than 4 m
Tidal Asymmetry: shallow water effects on tidal waves = local height of tidal wave above still-water level, small in deep water
The mean sea level trend is 2.77 millimeters/year with a 95% confidence interval of +/- 0.09 mm/yr based on monthly mean sea level data from 1856 to 2006 which is equivalent to a change of 0.91 feet in 100 years. • The plot shows the monthly mean sea level without the regular seasonal fluctuations due to coastal ocean temperatures, salinities, winds, atmospheric pressures, and ocean currents.
The average seasonal cycle of mean sea level, caused by regular fluctuations in coastal temperatures, salinities, winds, atmospheric pressures, and ocean currents
The plot shows the interannual variation of monthly mean sea level and the 5-month running average. The average seasonal cycle and linear sea level trend have been removed. Interannual variation is caused by irregular fluctuations in coastal ocean temperatures, salinities, winds, atmospheric pressures, and ocean currents.
New York City Panel on Climate Change, 2009 1 Based on 16 GCMs (7 GCMs for sea level rise) and 3 emissions scenarios. Baseline is 1971-2000 for temperature and precipitation and 2000-2004 for sea level rise. Data from National Weather Service (NWS) and National Oceanic and Atmospheric Administration (NOAA). STET and sea level data is from the Battery at the southern tip of Manhattan (the only location in NYC for which comprehensive historic sea level rise data are available). 2 Central range = middle 67% of values from model-based probabilities; temperatures ranges are rounded to the nearest half-degree, precipitation to the nearest 5%, and sea level rise to the nearest inch. 3 The model-based sea level rise projections may represent the range of possible outcomes less completely than the temperature and precipitation projections. See page 18 for more information. 4 “Rapid ice-melt scenario” is based on acceleration of recent rates of ice melt in the Greenland and West Antarctic Ice sheets and paleoclimate studies.