Paleooceanography and Sea-level Changes
Paleooceanography and Sea-level Changes. Chapter 6. Information about past history of the ocean basins comes from Magnetic anomalies and related data The seafloor sediments These retain a record of the events in the overlying waters Also can tell us about sea level change.

Paleooceanography and Sea-level Changes
E N D
Presentation Transcript
Paleooceanography and Sea-level Changes Chapter 6
Information about past history of the ocean basins comes from • Magnetic anomalies and related data • The seafloor sediments • These retain a record of the events in the overlying waters • Also can tell us about sea level change
The thickness of the sediments increase with distance from the spreading ridge • Why? • Near the ridge they are 1-2 m thick • On the abyssal plain they are 1 km or more • On the continental slope-rise 10 km or more
Sediments that settle from suspension in the open ocean are called pelagic sediments • Main types • Biogenic calcareous sediments • Biogenic siliceous sediments • Inorganic red clay • Inorganic ice-rafted sediments
Red clays are the smallest particles • Red is from iron oxide • Also contains volcanic ash and meteoritic fragments • The latter accumulate at 0.1-1.0 mm / 106 yr
Biogenic sediments just means biological materials accumulate at higher rates than other materials • Used to be called oozes • May contain 50% or more clay
Distribution is controlled by • Climate and current patterns • Nutrient (upwelling) induced biological production • Relative solubilities of calcium and silica • Calcium dissolves more readily under high pressure • Calcium dissolves more readily in cold water
The lower parts of sediment layers may have been affected by warm water solutions • Although this ceases after the crust is about 70 Ma old.
In early ocean basins evaporites may form • These are later buried by sediments • The salts are less dense and plastic • Can be forced upward • Evaporites form salt pillars or domes • These are good traps for hydrocarbons • Oil and gas are result of anaerobic decomposition of plankton
One of the most spectacular examples of anticlinal fold structures lie on the north shore of the Strait of Homuz in the Persian Gulf. • Located near the important city of Bandar Abbas, these folds form the foothills of the Zagros Mountains, which run north-northwesterly through Iran. • The folds were formed when the Arabian shield collided with the western Asian continental mass about 4 to 10 million years ago.
The other features that are prominent in this photograph are the dark circular patches. • These represent the surface expression of salt domes that have risen diapirically from the Cambrian Hormuz salt horizon through the younger sediments to reach the surface. • Only in a hot arid environment such as that of the Gulf can the soluble salt escape rapid erosion.
In the 1980s it was discovered that communities similar to those at hydrothermal vents were found at the continental margin at 1000 m deep. • Seeps and vents of cold water along with H2S and CH4 • Chemosynthetic sulfide-oxidizing bacteria • The seeps are caused by dewatering of sediments due to compaction
Sediments and Paleoceanography • The Antarctic Circumpolar Current driven by west winds • Continuous around Antarctica • Reaches depths of 3-4,000 m • Did not always exist • Not before all the southern continents separated from Antarctica
Orsi A. H., T. Whitworth and W. D. Nowlin. 1995. On the meridional extent and fronts of the Antarctic Circumpolar Current. Deep-Sea Research 42(5): 641673.
The southern continents started moving away as early as 170 Ma ago • Oceanic crust did not form between South America and the Antarctic prior to 20 Ma • Jenkins (1978) argues about 28 Ma • There are indications that there was a connection prior to this based on the spread of marine fauna • Foram Guembelitria
This connection is postulated to have been due to rifting • So true seafloor spreading had not been initiated yet
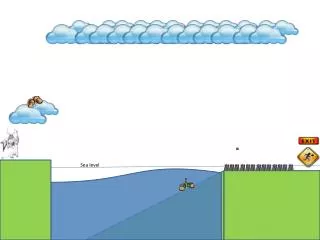
Changes in Sea-Level • Ocean bathymetry changes significantly only on time scales of 106-107 years • The geoid is the hypothetical surface of the Earth that coincides everywhere with mean sea level and is perpendicular, at every point, to the direction of gravity. • The geoid is used as a reference surface for astronomical measurements and for the accurate measurement of elevations on the Earth's surface • Sea level fluctuations can occur on scales of decades to centuries
Sea-level is the level to which the ocean basins between the continents are filled at any particular time • Since all the basins are interconnected, filling one would also fill the others • This is known as eustatic sea-level change
The equilibrium level is determined by • Volume of water in the oceans • Inputs – precipitation, rivers and groundwater, melting of ice • Shape of the container • Global thickness and area of continental crust • Relative thermal states of ocean and continental crusts, volume of large igneous provinces • Mass of water and sediment load on the oceanic crust
Water expansion is 2.1 x 10⁻⁴ºC-1 • How change in sea level would a 1ºC increase cause? Avg depth = 3.7 km
3.7 km x 1000m/km x 1ºC x 2.1 x 10-4ºC-1 = 0.777 m
Time Scales • Sea-level is subject to numerous local and short term changes • Some of great magnitude (10s of meters) • Tidal fluctuations • Wind waves • Barometrically induced surges • Tsunamis • Freshwater floods • Ship wakes
Other factors affecting local sea level • wind and ocean currents that can "pile up" the ocean water locally, temperature anomalies like El Niño, local gravity wells of ice sheets and land masses, and regional salinity levels that alter the water's density. • Measurement of these levels is further complicated by changes in land height as the Earth's crust moves up or down from tectonic motion and rebounds after long and recently ended glaciation, although these complications are avoided by using satellite measurements.
Mean sea level is defined from long-term averages • Changes of 1 mm yr-1 can be detected • Most analysis of recent past use tide gauge records • Need to account for seasonal, tidal and episodic events
Atmospheric pressure changes can affect sea level • 1 mbar of pressure change affects sea level by about 1 cm • Tide gauge data is now supplemented by deep sea pressure gauges
All earthbound gauges suffer from possible crustal movement • Cause local rise or fall • These are called isostatic sea level changes
Satellite Sea-Level • Satellite altimeters have been used to measure the marine geoid • TOPEX/Poseidon measured sea surface from 1992 • Cover globe from 66ºS to 66ºN every 10 days • TOPEX visualization • Most changes however are short term • Like the El Nino on the next slide
A global increase in sea level was detected in the TOPEX record
Have to consider the mixed layer • Reasonable to assume 100m • Assume it warmed 0.2 ºC in 1993-95 • 100 m x (2.1 x 10-4ºC-1) x 0.2 ºC = 4.2 mm • = 2.1 mm per year • Short term thermal expansion plays an obvious role
The sea level rise has been going on for the past 20,000 years • Why is that? • The rate has increased due to human activities in the last century
Post-Glacial Rise in SL • Several times in Earth history that there have been major ice sheets at high latitudes • Most recent was in the Quaternary (1.6 Ma ago) and it may not be over yet • Within this period there have been several glaciations • The most recent from 120,000 to 20,000 years ago • So there may be another one on the way
The initial rise in sea level was rapid from 18,000 years ago to about 6,000 years ago
Things are complicated due to isostatic factors • Additional loading on the oceanic crust can depress it • There is no easy way to separate local isostatic adjustments from eustatic change
Measuring Quaternary Changes • We don’t have sufficient evidence to evaluate isostatic adjustments to sea level change in the or Quaternary. • Only evidence of the static changes
The technique used to past marine temperatures is also value to studying sea level fluctuations • It relies on differential incorporation of the 18O and 16O isotopes into calcium carbonate • 99.763% of natural oxygen is 16O and 18O • The ratio can be measured with a mass spectrometer
Marine organisms incorporate oxygen isotopes into their skeletal parts in different proportions depending on temperature • To lower the temperature at the higher the 18O:16O ratio • The ratio depends somewhat on species • Forams are ideal because they are abundant widespread and have hard parts of calcium carbonate
A complication arose when benthic forams showed as great a variation in oxygen isotope ratios as surface forams • This seemed improbable because bottom waters should be more consistent in temperature • How can this be explained then?
It has to do with evaporation and precipitation • Water vapor tends to be enriched in molecules containing the lighter isotopes, relative to the liquid from which it evaporated • With water vapor condenses there is fractionation in the other direction • Condensed water is enriched in the heavier isotope