The Variability of the Boundary Line Between Soil Survey Mapping Units.
The Variability of the Boundary Line Between Soil Survey Mapping Units. Dustin Hancock Why is this research important? Methods Results

The Variability of the Boundary Line Between Soil Survey Mapping Units.
E N D
Presentation Transcript
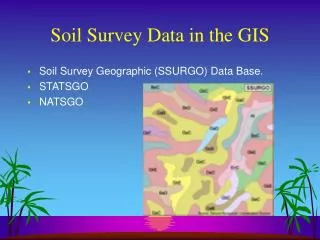
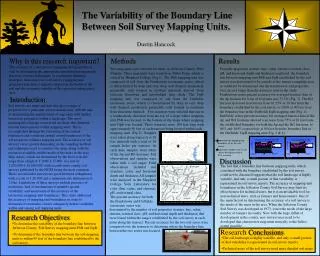
The Variability of the Boundary Line Between Soil Survey Mapping Units. Dustin Hancock Why is this research important? Methods Results The accuracy of a soil survey’s mapping unit properties is vital in determining the appropriate agricultural management practices, forestry techniques, or community planning strategies. Inaccuracy in a soil survey's mapping unit properties may have a negative impact on the health of the soil and the economic viability of the operation taking place on it. Two map units were selected for study in Jefferson County, West Virginia. These map units were located on Tabler Farm, which is owned by Shepherd College (Fig.1). The FbB mapping unit was composed of soil from the Frankstown taxonomic series, which is characterized by deep and very deep well drained, moderately permeable soils formed in residual materials derived from siliceous limestone and interbedded limy shale. The DgB mapping unit was composed of soil from the Duffields taxonomic series, which is characterized by deep to very deep well drained, moderately permeable soils formed in residuum from limestone bedrock Two transects were selected that ran in a southeasterly direction from the top of a slope where mapping unit FbB was located, to the bottom of the slope where mapping unit DgB was located. These transects were 180 feet long with approximately 90 feet of each transect being located within each From the properties (texture, hue, value, chroma, textural class, pH, and horizonal depth and thickness) analyzed, the boundary line between mapping unit FbB and DgB established by the soil survey was determined to be outside of the transect sampling area or could not be determined due the transition of soil properties over an area larger than the transects used in the study.Frankstown series percent accuracy for averaged transect data of the Ap horizon for 9 out of 10 points was 37.5% (Fig. 3). The Bt1 horizon increased in accuracy from 81.25% at 10 feet from the boundary established by the soil survey, to 100% at 90 feet from the boundary line in the Duffields DgB mapping unit (Fig. 4). Duffields’ series percent accuracy for averaged transect data of the Ap and Bt1 horizons showed a increase from 75% at 10 feet from the established boundary for both the Ap and the Bt1 horizons, to 94% and 100% respectively at 90 feet from the boundary line in the Duffields’ DgB mapping unit (Fig. 3 & 4). Introduction Soil surveys are maps and data that give a range of properties for a particular soil taxonomic unit, with the aim of determining the spatial extent of map units with similar taxonomic properties within a landscape. The most meaningful soil maps constructed are those that diminish internal heterogeneity within mapping units. This is accomplished through the conveying of the central tendencies and variations around central tendencies of the soil properties within a mapping unit. The accuracy of soil surveys varies greatly depending on the sampling methods and techniques used to construct the map, along with the resources available and the needs of the users in the area. Map orders, which are determined by the level of detail, range from a high of 1:1000-1:15,000 to a low of 1:250,000-1:10,000,000, with second-order county soil surveys published by the NCSS being the most common. These second order surveys are georeferenced orthophotos with a scale of 1:20,000 and a minimum size delineation of 1.6 ha. Limitations of these surveys include presence of inclusions, lack of mechanisms to quantify spatial variability, and uncertainty of the accuracy of the taxonomic mapping unit boundaries. This study addressed the accuracy of mapping unit boundaries in order to determine if taxonomic classes adequately define variability within and among soil mapping units. mapping unit (Fig.2). Samples were taken along transects at 20 feet intervals with a total of 10 sample holes per transect. At each hole samples were taken of the Ap and Bt1 horizons. Soil observations and samples were taken with a soil auger. Field observations included soil structure, color, and horizonal depth and thickness.All samples were analyzed in the Shepherd College Soils Laboratory for color (hue, value, and chroma), pH, and textural class. represents the mapping unit boundary set by the soil survey. represents samples that fit soil survey description with a 85% accuracy. Discussion Figure. 3 Figure 4 Fig.1 tabler Farm,Shepherdstown. (WVExplorere.com) The fact that a boundary line between mapping units, which correlated with the boundary established by the soil survey, could not be discerned suggests that the soil landscape is highly variable, and only a small portion of that variability is represented in soil survey reports. The accuracy of mapping unit boundaries in the Jefferson County Soil Survey may limit its effectiveness for technical users, but it is an invaluable tool for non-technical users, such as farmers and homeowners. One of the main factors in determining the accuracy of a soil survey is the needs of the users in the area. When the Jefferson County Soil Survey was developed in 1973, it met the needs of the large number of farmers in county. Now with the large influx of development in the county, new surveys may need to be developed that characterize map units statically to the fullest extent possible. The percent accuracy for both the Frankstown and Duffields taxonomic series was Fig. 2. Transects used in the study. (Jefferson County soil Survey, 1973 determined by the number of soil properties (texture, hue, value, chroma, textural class, pH, and horizonal depth and thickness) that were found within the ranges established by the soil survey at each point along the transect. Percent accuracy for the two soil series were compared over the transects to determine where the boundary line between the two series was located. Research Objectives • To determine the variability of the boundary line between Jefferson County Soil Survey mapping units FbB and DgB. • To determine if the boundary line between the soil mapping units is within 99 feet of the boundary line established by the soil survey. Research Conclusions • The soil landscape is highly variable, and only a small portion of that variability is represented in soil survey reports. • Technical users of the soil survey need more detailed soil maps.