Download
1 / 13
160 likes | 391 Vues
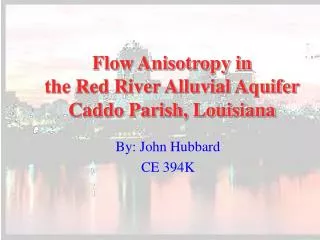
Flow Anisotropy in the Red River Alluvial Aquifer Caddo Parish, Louisiana. By: John Hubbard CE 394K. Problem. Can ArcView be used effectively to map the potentiometric surface in an anisotropic aquifer? Can flow direction be determined using spatial analyst?. Study Area.

E N D
Flow Anisotropy inthe Red River Alluvial Aquifer Caddo Parish, Louisiana By: John Hubbard CE 394K
Problem • Can ArcView be used effectively to map the potentiometric surface in an anisotropic aquifer? • Can flow direction be determined using spatial analyst?
Red River Alluvium • Covers 2,120 sq. Miles of Louisiana • Composed of medium to fine-grained sand and silt. • Silt acts as retarding units with-in the alluvium
Wells • Data from 69 USGS observation wells were obtained • Dates after 1990 were thrown out due to the construction of lock-and-dam. • 1980 was selected as an average year with the most data available leaving 38 wells to be mapped
Well Data • The high, low elevations of the head in each well were sorted • The mean annual head elevation was calculated
Longitude and Latitude • Data about each well was obtained from the Louisiana Department of Transportation and Development • Longitude and Latitude were sorted in Excel and converted to decimal degrees
Plotting Well Data • The Elevation Table and Long/Lat Table were added to ArcView and joined by well number • The newly joined elevation table mapped using “Add Event Theme” • A decrease in head elevation can be seen from north to south
Spatial Analyst • The spatial analyst extension was then loaded and the “surface/interpolate grid” function was used • This produces a potentiometric map • However, this map shows no reference to the river or the edge of the alluvium
Spatial Analyst 2 • The spatial Analyst was run again, however, this time the NHD file 11140202.shp, was placed as a barrier • Again, this produces another potentiometric map
More Spatial Analyst • The Spatial Analyst was then used to calculate the the aspect of the potentiometric surface to approximate flow direction
Issues and Problems • Lack of data • No western border • River stage was not included • Aspect does not account for anisotropy