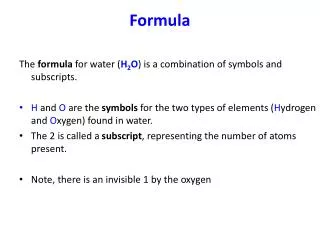
Formula
Formula. Compute a standard deviation with the Raw-Score Method. Previously learned the deviation formula Good to see “what's going on” Raw score formula Easier to calculate than the deviation formula Not as intuitive as the deviation formula They are algebraically the same!!.


Formula
E N D
Presentation Transcript
Compute a standard deviation with the Raw-Score Method • Previously learned the deviation formula • Good to see “what's going on” • Raw score formula • Easier to calculate than the deviation formula • Not as intuitive as the deviation formula • They are algebraically the same!!
Raw-Score Formula Note: This is the formula for both and S
Step 4: Plug in values N = 5 X = 44 X2 = 640
Step 4: Plug in values 5 5 N = 5 X = 44 X2 = 640
Step 4: Plug in values 44 5 5 N = 5 X = 44 X2 = 640
Step 4: Plug in values 44 640 5 5 N = 5 X = 44 X2 = 640
Step 5: Solve! 1936 44 640 5 5
Step 5: Solve! 1936 44 640 387.2 5 5
Step 5: Solve! 1936 44 50.56 640 387.2 5 5 Answer = 7.11
Practice • Use the raw score formula and find the standard deviation of: 6, 3, 4, 10, 8
31 225 5 5 N = 5 X = 31 X2 = 225
1936 44 225 192.2 2.56 = 5 5
Ŝ • What if we want to use a sample standard deviation to estimate the population ? • We need to make one small change to the formula to do this • You need to make the s an “unbiased estimator”
Ŝ • To do that you use Ŝ • This provides an estimate of the populations variability
Remember S =
Just “ - 1” Ŝ= -1
Why? • The first formula is biased -- its answer tends to be too small • Don’t worry about why -- unless you want too!!
Practice! • Below is data from 5 people in this class. What is the estimated standard deviation of all the students in this class? Use the Ŝ raw score formula. • Neuroticism scores 12, 15, 22, 10, 9
68 1034 5 5 - 1 N = 5 X = 68 X2 = 1034
1936 44 1034 924.8 5.22 = 5 4
Variance • The last step in calculating a standard deviation is to find the square root • The number you are fining the square root of is the variance! 2 = population variance Ŝ2 = sample variance used to estimate 2
Variance S 2, 2 = Ŝ2 =
Variance S 2, 2 = Ŝ2 = - 1
There are 12 different formulas! • Standard Deviation • Deviation Formula , S, Ŝ • Raw Formula , S, Ŝ • Variance • Deviation Formula 2, S 2, Ŝ2 • Raw Formula 2, S 2, Ŝ2
Review -- Important Formulas • Standard Deviation -- Deviation Formula = Ŝ =
Review -- Important Formulas • Standard Deviation -- Deviation Formula
Review -- Important Formulas • Variance -- Deviation Formula 2 = Ŝ2 =
Review -- Important Formulas • Variance -- Deviation Formula 2
Review -- Important Formulas • Standard Deviation -- Raw Formula and S = Ŝ = - 1
Review -- Important Formulas • Variance -- Raw Formula 2 and S2 = Ŝ2 = - 1
How to know which to use • 1) Does the question want a standard deviation or a variance (most of the time standard deviations are used) • 2) Is the group of scores a sample or population? • 3) If it’s a sample, do you want to generalize the findings to a population?
Practice • You are interested in how citizens of the US feel about the president. You asked 8 people to rate the president on a 10 point scale. Describe how the country feels about the president -- be sure to report a measure of central tendency and the standard deviation. 8, 4, 9, 10, 6, 5, 7, 9
Central Tendency 8, 4, 9, 10, 6, 5, 7, 9 4, 5, 6, 7, 8, 9, 9, 10 Mean = 7.25 Median = (4.5) = 7.5 Mode = 9
Standard Deviation • Want to use Ŝ
Standard Deviation • Want to use Ŝ -1
Standard Deviation • Want to use Ŝ 452 58 8 8 - 1 -1
Standard Deviation • Want to use Ŝ 58 452 8 8 - 1 -1
Standard Deviation • Want to use Ŝ 452 420.5 7 -1