Download

1 / 38
420 likes | 858 Vues
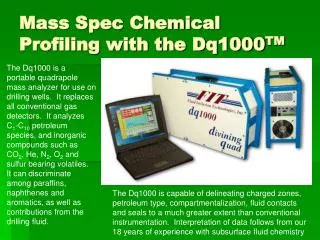
Mass Spec Chemical Profiling of Gas Composition in Real Time at Wellsite with the dq1000 Divining Quad. Mike Sterner and Don Hall Fluid Inclusion Technologies. Divining Quad Overview.

E N D
Mass Spec Chemical Profiling of Gas Composition in Real Time at Wellsite with the dq1000 Divining Quad Mike Sterner and Don Hall Fluid Inclusion Technologies
Divining Quad Overview • The dq1000 is a portable stand-alone mass spectrometer-based gas analyzer providing routine chemical analysis of paraffins, naphthenes, aromatics, organic acids, volatile inorganic compounds and mud additives, to infer petroleum type and quality, fluid contacts, proximity to pay, porosity, compartmentalization. • The dq1000 is fully automatic - requiring only a continuous supply of gas from the extractor, a depth input and a more-or-less continuous supply of electricity. • Together with FIT’s proprietary server software and a satellite uplink, real time data are available virtually anytime, anywhere….
Analytical Limitations of Conventional Gas Equipment • TGD records total combustible hydrocarbons without compound specificity • GC generally analyzes gas-range n-alkanes, which react similarly to subsurface processes. Other two major classes of hydrocarbons (naphthenes and aromatics) not recorded • Generally poor performance on C5+ at low concentration • Analysis of inorganic compounds (e.g., CO2, H2S, He) requires special equipment • Infexible to specific needs of individual wells
Species Analyzed by the dq1000 • C1-C10organic species • Discriminates among paraffins, naphthenes and aromatics • BTEX compounds and organic acids • Inorganic volatiles such as CO2, He, N2 and other atmospherics, H2S and other sulfur species, H2, etc. • Identifies contribution from mud system and organic additives
Why Analyze these Additional Compounds? • Better estimates of petroleum type and quality • Identifying fluid contacts • Delineating porosity/permeability trends • Inferring nearby charge in wet reservoirs • Establishing reservoir and basin compartmentalization
Interpretation of dq1000 Data • Based on Fluid Inclusion Stratigraphy (FIS) analysis of thousands of wells worldwide over the last 15 yrs
FIS Data Organic Acid Lith Log Black = Inorganic species Red = Gas-range HC’s Blue = Water-soluble species Green = liquid-range HC’s Benzene E-logs CO2 H2S C1 C7 CS2 SEAL ZONE BYPASSED PAY ZONE THIN MIGRATION ZONES AND SEALS SEAL ZONE PAY ZONE GAS-OIL CONTACT OIL-WATER CONTACT
Interpretation of dq1000 Data • Verified by dq1000 analysis of 40+ wells over the last 5 yrs
HC’s to C8 Mostly atmosphere; minor dry gas HC’s to C8;wetter HC’s to C7 P/N HC’s to C7 with aromatics HC’s to C10;wetter; aromatic rich B T B P/N X T dq1000 Mass Spectra Examples
Mass Spec Chrom Mass Spec Chrom Mass Spec Chrom C1 C3 C3 C5 C5 C1 S/N = S/N = S/N = S/N = 4:1 3:1 2:1 1.5:1 S/N = 2:1 S/N = N/A Comparison of dq1000 and Conventional GC: C1-C5 Performance; 250 GU Anomaly
C5 C6 C7 C8 C9 C1 25 ppm 0.3 ppm baseline shift 1 ppm baseline shift dq1000 C6+ Performance; 2000 GU Anomaly
SHOW 1 SHOW 3 SHOW 2 C1 C1 C1 B W B W Gas-Cond (Tested) B W Possible oil (Untested) Possible Gas (Untested) Balance = (C1+C2)/(C3+C4+C5) Wetness = (Sum C2 to C5)/(Sum C1 toC5) dq1000 Balance and Wetness Ratios in Three Shows; Improved Est. Ptrlm Type
Fluid Contacts; dq1000 Data Bacterially altered wet gas anomaly. High CO2 resulted in suppressed readings on conventional TG and GC equipment. Sulfur species are concentrated in the water leg. Subtle relative benzene anomaly in water leg Sulfur species CO2 Porosity Compartment indicators Suppressed TG Detect. Top of Show HC’s to C7 Gas-Water Contact
Proximity to Pay (PTP): BTEX in Oil Field Brines Buccaneer Field; Galveston Blks. 288 and 296; GOM BTEX compounds are fractionated into brine due to their high solubility in water From Burtell and Jones; OGJ; June ‘96
PTP: Benzene in Nisku Brines 5 1 Benzene Concentration (ppm) 0.2 4 8 12 From Burtell and Jones; OGJ; June ‘96 Distance to Production (miles)
Proximity to Pay: FIS Data FIS data document diffusion of BTEX and organic acid across lateral fault seal at reservoir depth. Similar anomalies are seen in the water leg. Presence of these features significantly enlarges exploration target and extends view well beyond the limits of the borehole BTEX and organic acid anomalies in reservoir equivalent section across fault C7 Benzene Acetic Acid Benzene Oil indications in reservoir BTEX and organic acid anomalies in water leg to updip oil reservoir. = diffusion of water soluble species
Proximity to Pay; dq1000 Data Huge BTEX anomaly Sulfur species CO2 Compartment indicators Bacterially altered wet gas anomaly; indications of nearby charge Proposed compartments Sand probably charged up-dip with altered wet gas Tight Porous Possible residual HC zone Porous Possible Paleo-HC-water contact Tight
Seal Definition and Reservoir Compartments; FIS Data Methane FIS methane response indicates effectiveness of top seal and inter-reservoir seal. Fluid inclusions in the two reservoirs have discrete chemistries. Biomarker work indicates a separate source for the two fluids. SEAL A SEAL B
Reservoir Compartmentalization; dq1000 Data Elevated BTEX in Seals overlying shows Increase porosity with depth in SHOW #2 SHOW #1 compartmentalized. SHOW #2 wetter; chemically distinct; better porosity; out of communication with SHOW #1. Compartment indicators Top Show #1 SHOW #1 Base Show #1 Top Show #2 SHOW #2 Base Show #2
ROP CO2 Pressure Compartments; dq1000 Data Onset of overpressure indicated by increase in CO2 in relatively monotonous carbonate sequence. Note also parallel decrease in ROP associated with drilling harder rock
Elevated relative benzene in sand overlying proposed source rock may indicate lateral charge Sulfur species CO2 Compartment indicators Mature Source Rock; dq1000 Data High gas readings in shale; low in overlying sand. Associated anomalous species include CO2, organic acid and sulfur compounds. Data suggest that shale is oil-mature active source rock. Possible up-dip charge
Porosity and Basin Compartments; dq1000 Data Differences among trends are primarily related to fluid source and migration history. Differences along trend are primarily related to porosity. Secondary porosity effects (e.g., in tight rock) may contribute to scatter around trends Data from Anomalies in Well “A” Trend 1 Trend 2 Trend 3 Trip gas composition correlates to zone (s) from which it is derived
The Woodford Fm, in this area is characterized by anomalous hydrogen, and preliminary observations suggest that highest hydrogen concentrations are observed in best quality source rock. Other potential source shales in the penetrated section do not contain anomalous hydrogen; consequently, data can be used to infer Woodford gas contribution to reservoirs in the vicinity. Other potential applications include identification of intra-Woodford fractures, and elucidation of source rock quality and maturity. Similar approaches may benefit shale gas plays in general.
dq1000 Application Conclusions • Effective single-instrument replacement for the TGD and GC • Better measurement of wet-gas and liquid-range organic species even at low TG • Superior chemical characterization from measurement of wide range of compounds • Data used to infer petroleum type and quality, fluid contacts, proximity to pay, porosity, compartmentalization
Mass Spec in the Field • Portable mass specs deploy like conventional gas detection equipment • Gas Extractor • Pump • Filters • Flow Regulators • Satellite dish ?
Hardware Overview • Scanning quadrupole mass spectrometer and two-stage turbo pumping system routinely monitor chemical variations over a dynamic range of 7+ orders of magnitude. • Standard issue PC/laptop computer - running any windows based operating system makes on-the-spot computer repair/replacement trivial. Full swap-out can be accomplished in ~5 min. • Field serviceable - most routine maintenance operations can be performed on-site by logger. TBF (un-manned service ~ 9 wks and counting)
Hardware Cont’d. • Full Electronic Isolation - Shielded, Surge Protected, UPS Battery Backup, providing continuous, uninterrupted service in extremely hostile environments. • International Deployment - electrical power requirements are 90-240 VAC, 50-60 Hz. Included UPS provides minimum of 20 min power backup - scaleable as necessary.
Software Overview • FIT’s dq1000 Divining Quad trap-gas analyzer uses a proprietary, WITS compatible, Windows-based software driver developed by FIT. • The software optimizes the application of mass spectrometry to well site geochemistry, incorporating depth and other essential drilling parameters monitored by dq1000’s internal circuitry and associated external sensors into LAS-format digital output suitable for display, data transfer and archival. • Together with FIT’s proprietary server software and a satellite uplink, real time data are available virtually anytime, anywhere….
Analytical Overview • Unit Mass Discrimination from AMU = 1 - 140 • Analytical cycle time is adjustable between 15 seconds and 6 minutes (nominally ~2 min/cycle) • Dynamic analytical range of 7+ orders of magnitude • Fully temperature compensated • Calibrate with standard test gases (minimal drift requiring infrequent calibration) • Discriminates paraffins, naphthenes, aromatics, organic acids, CO2, He, N2, O2, H2S, H2 andmud additives
Seal Zone N2 O2 N,N++ H2O Ar CO2 C1 Ar++ Pay Zone C4 Naphthene C1 C4 Paraffin H2 C3 CO2 He C5 Benzene Toluene Xylenes C7 C9 H2S Representative Chemistries
Reproducibility Curves intentionally offset to allow comparison
Depth/Drilling Parameter Monitoring • Driller depth, and other parameters, i.e., ROP, lag, pump strokes, etc. necessary to provide a complete mud log can be monitored from LAN broadcasts and incorporated into the final log. • Alternatively, depth, circulation and pump strokes (up to 3 pumps) can be monitored using the dq1000’s internal circuitry and associated external sensors for calculation of lag and ROP and these parameters can in turn be re-broadcast over a LAN along with chemical data if desired.
Dq1000 Specifications • Dimensions: 26in x 7.5in x 15in • Weight: 61 lbs (portable) • Power: 85-264 VAC (3.0-1.5 Amp) 47-63 Hz (international) • Network: LAN, Internet, Satellite • Sensors: Mud Circulation, Pump Strokes, Depth, Gas Extraction Line Flow • Cycle Time: 15 sec – 6 min (2 min nominal) • Modes: Dual (differential) or Single Port Gas Stream