Download

1 / 17
220 likes | 699 Vues
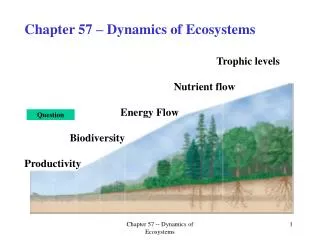
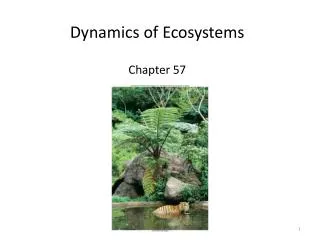
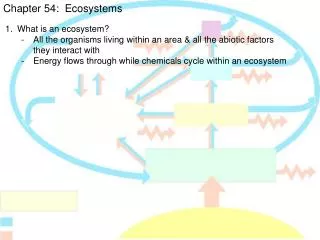
Dynamics of Ecosystems Chapter 57. Biogeochemical Cycles. Biogeochemical cycles: chemicals moving through ecosystems; biotic and abiotic Can cross the boundaries of ecosystems (one ecosystem might import or export chemicals to another). Biogeochemical Cycles. Water Cycle

E N D
Biogeochemical Cycles • Biogeochemical cycles: chemicals moving through ecosystems; biotic and abiotic • Can cross the boundaries of ecosystems (one ecosystem might import or export chemicals to another)
Biogeochemical Cycles • Water Cycle • All life depends on the presence of water • Amount of water available determines the nature and abundance of organisms present • It can be synthesized and broken down • Synthesized during cellular respiration • Broken down during photosynthesis
Biogeochemical Cycles • Basic water cycle • Evaporation • Transpiration: 90% of evaporation is through plants • Condensation • Precipitation • Groundwater • Aquifers : provide 95% fresh water used in US
Biogeochemical Cycles • Water cycle
Biogeochemical Cycles • Changes in the supply of water to an ecosystem can radically alter the nature of the ecosystem • Deforestation disrupts the local water cycle • Water that falls as rain drains away • Tropical rain forest semiarid desert
Biogeochemical Cycles • Nitrogen Cycle • component of proteins and nucleic acids • Usually the element in shortest supply • Availability • Most cannot use N2 (gas) • Use NH3, and NO3-
Biogeochemical Cycles • Nitrogen fixation: synthesis of nitrogen containing compounds from N2 • Nitrification: N2 --> NH3 --> NO3- • Denitrification: NO3- --> N2 • carried out by microbes: free or living on plant roots • Nitrogenous wastes and fertilizer use radically alter the global nitrogen cycle
Biogeochemical Cycles • Nitrogen Cycle
Biogeochemical Cycles • Phosphorus cycle • Occurs in nucleic acids, membranes, ATP • Exists as PO43- in ecosystems • Plants and algae use free inorganic phosphorus, animals eat plants to obtain their phosphorus
Biogeochemical Cycles • Phosphorus cycle
Biogeochemical Cycles • carbon cycle (important component of bodies ~20% of human body weight)
Biogeochemical Cycles • Respiration/photosynthesis • Methane producers: anaerobic cellular respiration releases CH4 • Decomposition: releases CO2 • Combustion: burning fossil fuels produces CO2
Biogeochemical Cycles • Over time, globally, the carbon cycle may proceed faster in one direction • Human burning of fossil fuels is creating large imbalances in the carbon cycle • The concentration of CO2 in the atmosphere is going up year by year
Biogeochemical Cycles • Limiting nutrient: weak link in an ecosystem; shortest supply relative to the needs of organisms • Fe for algal populations • N and P for both terrestrial and aquatic ecosystems
Biogeochemical Cycles • Biogeochemical cycling in a forest ecosystem-- Hubbard Brook Experiment • Undisturbed forests are efficient at retaining nutrients • Disturbed (cut trees down) amount of water runoff increased by 40% • Loss of Ca; increased nine fold • Loss of Phosphorus did not increase • Loss of NO3-; 53kg/hectare/yr
Biogeochemical Cycles The Hubbard Brook Experiment 38-acre watershed. Orange curve shows nitrate concentration in the runoff water from the deforested watershed. Green curve shows the nitrate concentration in runoff from an undisturbed watershed