
1. Introduction
Critical Assessment of TOMS-derived Tropospheric Ozone: Comparisons with Other Measurements and Model Evaluation of Controlling Processes. M. Newchurch 1 , D. Sun 2 , X. Liu 2 , J. H. Kim 3 , R.V. Martin 4 , D. Jacob 4 J. Logan 4 , K. Han 3 , S. Na 3

1. Introduction
E N D
Presentation Transcript
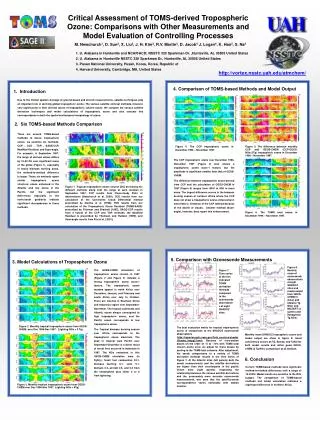
Critical Assessment of TOMS-derived Tropospheric Ozone: Comparisons with Other Measurements and Model Evaluation of Controlling Processes M. Newchurch1, D. Sun2, X. Liu2, J. H. Kim3, R.V. Martin4, D. Jacob4 J. Logan4, K. Han3, S. Na3 1. U. Alabama in Huntsville and NCAR/ACD; NSSTC 320 Sparkman Dr. ,Huntsville, AL 35805 United States 2. U. Alabama in Huntsville NSSTC 320 Sparkman Dr., Huntsville, AL 35805 United States 3. Pusan National University, Pusan, Korea, Korea, Republic of 4. Harvard University, Cambridge, MA, United States http://vortex.nsstc.uah.edu/atmchem/ 4. Comparison of TOMS-based Methods and Model Output 1. Introduction Due to the limited spatial coverage of ground-based and aircraft measurements, satellite techniques play an important role in deriving global tropospheric ozone. The various satellite retrieval methods, however, vary significantly in their derived values of tropospheric column ozone. We compare the various satellite derivation techniques and model calculations of tropospheric ozone and also evaluate this correspondence in both the spatial and temporal morphology of ozone. 2. Six TOMS-based Methods Comparison There are several TOMS-based methods to derive tropospheric ozone. we examine six methods, CCP , CCD , TOR , SAGE/CCP, Modified Residual, and Scan-angle. For example, in September 1997, the range of derived values differs by 10-20 DU over significant areas of the globe (Figure 1), especially in heavy biomass burning areas, the method-to-method difference is larger. Those six methods report similar tropospheric ozone structure: ozone enhanced in the Atlantic and low ozone in the Pacific, but the significant differences especially in the north/south gradients indicate significant discrepancies in these methods. • Figure 4. The CCP tropospheric ozone in December 1996 – November 1997. • Figure 5. The difference between monthly CCP and GEOS-CHEM (CCP-GEOS: NOx=3Tg) tropospheric ozone in December 1996 – November 1997. The CCP tropospheric ozone over December 1996- November 1997 (Figure 4) also shows a tropospheric ozone wave-1 feature, but the amplitude is significant smaller than that of GEOS-CHEM. The difference between tropospheric ozone derived from CCP and the calculation of GEOS-CHEM in 1997 (Figure 5) ranges from -8DU to 4DU in most areas. The largest difference occurs in the biomass burning season of northern Africa where the CCP does not show a tropospheric ozone enhancement; most likely a limitation of the CCP method because of the dearth of clouds. Another method (Scan-angle), however, does report this enhancement. • Figure 1. Tropical tropospheric ozone column [DU] derived by six different methods along with the range at each location in September 1997. CCP results from Clear-cloudy Pairs of observations [Newchurch et al. 2000], CCD results from our calculation of the Convective Cloud Differential method prescribed by Ziemke et al. [1998], TOR results from our calculation of the Tropospheric Ozone Residual (TOMS-SAGE) prescribed by Fishman and Brackett [1997], SAGE-CCP results from a hybrid of the CCP and TOR methods, the Modified Residual is prescribed by Thomson and Hudson [1999], and Scan-angle results from Kim et al. [2001]. • Figure 6. The TOMS total ozone in December 1996 – November 1997. 5. Comparison with Ozonesonde Measurements 3. Model Calculations of Tropospheric Ozone • Figure 8. Monthly mean of ozonesonde observations at eight SHADOZ sites and model output from GEOS-CHEM (3 (blue) and 6(black) Tg NOx) and MOZART (3 (green) and 9(magenta) Tg NOx). The GOES-CHEM simulation of tropospheric ozone column in 1997 (Figure 2 and Figure 3) indicate a strong tropospheric ozone wave-1 feature. The tropospheric ozone maxima appear in north Africa over December, January, and February and south Africa over July to October. There are maxima in Southern Africa and Indonesia region over September-November. The tropical continents and Atlantic ocean always correspond to high tropospheric ozone, and the Pacific ocean corresponds to low tropospheric ozone. The Tropical biomass burning season over Africa corresponds to the tropospheric ozone maximum. The peak in tropical west Pacific over September-December is a direct result of forest fires occurred in Indonesia in 1997. The NOx emissions in this GEOS-CHEM simulation were (in TgN/y): fossil fuel combustion 23.1, biomass burning 6.1, soils 5.1, biofuels 2.2, aircraft 0.5, and 0.2 from the stratosphere plus either 3 or 6 from lightning. • Figure 7. Time series of the five indicated TOMS derivation methods compared to the ozonesonde observations at eight SHADOZ sites. • Figure 2. Monthly tropical tropospheric ozone from GEOS-CHEM over Dec 1996-Nov 1997. (Lighting NOx = 3 Tg) The best evaluation metric for tropical tropo-spheric ozone is comparison to the SHADOZ ozonesonde observations (http://hyperion.gsfc.nasa.gov/Data_services/shadoz/Shadoz_hmpg2.html). Because of intra-station biases on the order of –5 to –10% with TOMS total column ozone exist, we adjust for these biases by scaling to the TOMS total columns. After adjustment, the sonde comparisons to a variety of TOMS derivation methods results in the time series of Figure 7. At the Atlantic sites (left panels) both the sonde measurements and the satellite derivations are higher than their counterparts in the pacific Ocean sites (right panels). Inspecting the relationship between the various satellite derivations and the, presumably more accurate ozonesonde measurements, one sees that the satellite/sonde correspondence varies noticeably with station location. Monthly mean SHADOZ tropospheric ozone and model output are show in figure 8. Good consistency occurs at Fiji, Samoa, and Tahiti for both model results and rather good GEOS-CHEM (3 Tg NOx) comparison at all stations. 6. Conclusion Current TOMS-based methods have significant method-to-method differences with a range of 10-20DU. Model results are sensitive to the NOx budget. The comparison of TOMS-based methods and model calculation indicates a significant difference in northern Africa. • Figure 3. Monthly tropical tropospheric ozone from GEOS-CHEM over Dec 1996-Nov 1997. (Lighting NOx = 6Tg)


