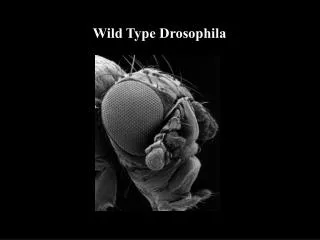
Wild type
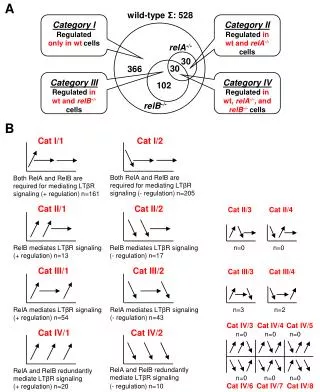
0 min utes. 10 min utes. 30 min utes. A. B. Afu8g05010 (transcription factor). Afu1g17460 (transcription factor). 25. 20. 20. 15. 15. Fold increase. Fold increase. 10. 10. 5. 5. 0. 0. ncsA. ncsA. Wild type. Wild type. C. D. Afu 2g16520 (phospholipase D).

Wild type
E N D
Presentation Transcript
0minutes 10minutes 30minutes A. B. Afu8g05010 (transcription factor) Afu1g17460 (transcription factor) 25 20 20 15 15 Fold increase Fold increase 10 10 5 5 0 0 ncsA ncsA Wild type Wild type C. D. Afu2g16520 (phospholipase D) Afu2g07630 (H+/Ca2+ exchanger) 20 25 20 15 Fold increase Fold increase 15 10 10 5 5 0 0 ncsA ncsA Wild type Wild type
E. F. Afu2g13060 (calcineurin binding protein) Afu2g11460 (transcription factor) 6 50 40 4 30 Fold increase Fold increase 20 2 10 0 0 ncsA Wild type ncsA Wild type G. H. Afu4g03460 (transcription factor) Afu3g05760 (transcription factor) 3 1.2 2 0.8 Fold increase Fold increase 1 0.4 0 0 ncsA Wild type ncsA Wild type
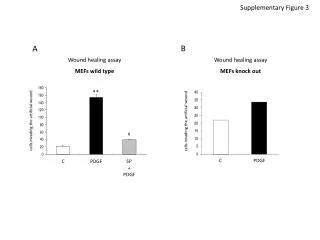
Supplementary Figure 3 - Fold increase in mRNA levels after the incubation with 200 mM CaCl2 for 10 and 30 minutes. Real-time RT-PCR was the method used to quantify the mRNA. The measured quantity of the (A) Afu8g05010 (C2H2 finger domain protein), (B) Afu1g17460 (C6 transcription factor), (C) Afu2g16520 (phospholipase D), (D) Afu2g07630 (vacuolar H+/Ca+2 exchanger), (E) Afu2g13060 (calcineurin binding protein), (F) Afu2g11460 (C6 finger domain protein), (G) Afu3g05760 (C6 transcription factor), and (H) Afu4g03460 (HLH DNA binding domain protein) mRNA in each of the treated samples was normalized using the CT values obtained for the -tubulin (Afu1g10910) mRNA amplifications run in the same plate.The relative quantitation of all the genes and tubulin gene expression was determined by a standard curve (i.e., Ct –values plotted against logarithm of the DNA copy number). The results are the means standard deviation of four sets of experiments. The values represent the number of times the genes are expressed compared to the corresponding control strain (either the wild type or ncsA) grown before adding 200 mM CaCl2 (represented absolutely as 1.00).