Download
1 / 17
170 likes | 288 Vues
Discover the evolution of technological innovation in agriculture from 1900 to 2005 and its impact on global food production. Explore the challenges faced by smaller farmers and the adoption of new technologies. Delve into the trends of biotech crops and the limitations faced in Africa. Learn about the importance of research and incentives for innovation to meet farmers' needs efficiently. Uncover the role of genetic and agronomic improvements in crop production and the essential factors driving successful agricultural innovations. Find out how societies can promote innovation through patents, public research, education, and innovation contests.

E N D
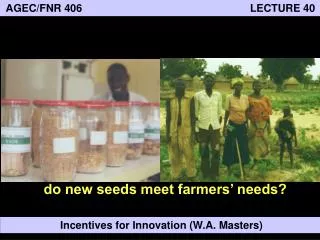
AGEC/FNR 406 LECTURE 40 do new seeds meet farmers’ needs? Incentives for Innovation (W.A. Masters)
Technological innovation often drives social change New technologies in the United States, 1900-2005 Percent of U.S. households What determines which innovations we get, and how fast they spread? 1900 1915 1930 1945 1960 1975 1990 2005 Source: Reprinted from W. Michael Cox and Richard Alm, “You Are What You Spend”, The New York Times 10 February 2008. Graphic by Nicholas Felton.
The timing and speed of new technology adoption is particularly important in agriculture Reprinted from Zvi Griliches (1957), “Hybrid Corn: An Exploration in the Economics of Technological Change”. Econometrica, 25(4, Oct.): 501-522 .
GLOBAL AREA OF BIOTECH CROPS Million Hectares (1996 to 2007) Total 23 Biotech Crop Countries 140 Industrial Developing 120 100 80 60 40 20 0 1996 1997 1998 1999 2000 2001 2002 2003 2004 2005 2006 2007 Source: Reprinted from Clive James (2008), “Global Status of Commercialized Biotech/GM Crops: 2007.” ISAAA Briefs No. 37. The latest wave of ag research is biotechnology
But so far, GM crops offer only two main features Global Area of Biotech Crops, 1996 to 2007: By Trait (Million Hectares) 80 70 Herbicide Tolerance Insect Resistance 60 Both together 50 40 30 20 10 0 1996 1997 1998 1999 2000 2001 2002 2003 2004 2005 2006 2007 Source: Reprinted from Clive James (2008), “Global Status of Commercialized Biotech/GM Crops: 2007.” ISAAA Briefs No. 37.
70 Soybean 60 Maize Cotton 50 Canola 40 30 20 10 0 1996 1997 1998 1999 2000 2001 2002 2003 2004 2005 2006 2007 The new GM traits are good for just a few crops Global Area of Biotech Crops, 1996 to 2007: By Crop (Million Hectares) Source: Reprinted from Clive James (2008), “Global Status of Commercialized Biotech/GM Crops: 2007.” ISAAA Briefs No. 37.
Fertilizer use is not converging to world levels, as it did in Asia
One reason for Africa’s lag is that its soils and moisture are unusually difficult Selected Soil Fertility Constraints in Agriculture (as percent of agricultural area) Note: Constraints characterized using the Fertility Capability Classification (Sanchez et al., Smith). Source: Stanley Wood (2002), IFPRI file data.
But crucially, most African farmers still use old seed types; new seeds are coming out now Source: Calculated from data in Evenson and Gollin, 2003.
Public Research Expenditure per Unit of Land, 1971-91 (1985 PPP dollars per hectare of agricultural land) 4 3 2 1 0 1971 1972 1973 1974 1975 1976 1977 1978 1979 1980 1981 1982 1983 1984 1985 1986 1987 1988 1989 1990 1991 Sub-Saharan Africa All Developing Countries All Developed Countries A key reason for slow innovation is simply that Africa has had little local research Source: Calculated from IFPRI and FAOStat file data
Payoffs from agricultural research are high everywhere, and for most kinds of research There are many studies, because payoffs are measurable and important Payoffs are compared using return on investment (annual percent rate of return) Which targets give the highest payoffs? Why? Source: Alston, J.M., M.C. Marra, P.N. Pardey, and TJ Wyatt. 2000. "Research returns redux: A meta-analysis of the returns to agricultural R&D." Australian Journal of Agricultural and Resource Economics, 44(2): 185-215.
To meet farmers’ needs, crop improvement involves multiple innovations Genetic improvement Agronomic improvement (by scientists, using controlled trials) (by farmers, using land & labor)
Successful techniques are often surprising traditional “flat” planting labor-intensive “Zai” microcatchments For these fields, the workers are:
Obtaining appropriate innovation is difficult • Research, development and dissemination is often… • a natural monopoly “non-rival” in production (once made, easily replicated) • a public good “non-excludable” in consumption (beneficiaries cannot be made to pay) • of unknown value until after adoption a “credence good” for funders and adopters (no one is willing to pay) • These market failures ensure that… • free markets provide too few appropriate new technologies • government or philanthropic intervention is needed
How can societies promote innovation? • Patents and other intellectual property rights • in 1787, patent law written into Article 1 of the U.S. constitution • works well for marketable innovations • Public research and education • in 1869, founding of Purdue University and others in the U.S. • works well when research institutions are trusted by taxpayers • Innovation contests and prizes • e.g. British reward for computing longitude at sea (1714-1773) • works well when sponsor can specify the target The limitations of (1) and (2) have led to a boom in (3) • $10 m. X Prize for civilian spaceflight (1995-2005), then others • $1.5 b. Advance Market Commitment for vaccine ( ? ) • ????? Prizes for Innovation in African Agriculture ( ? )