Download
1 / 22
220 likes | 237 Vues
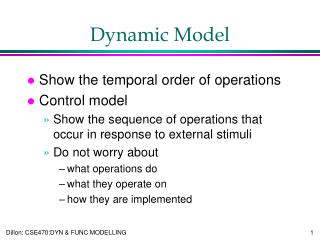
Dynamic Model for Stock Market Risk Evaluation. Kasimir Kaliva and Lasse Koskinen Insurance Supervisory Authority Finland. Goal : Stock Market Risk Modelling in Long Horizon. Phenomenon : Stock market bubble Model should work from one quarter to several years

E N D
Dynamic Model for Stock Market Risk Evaluation Kasimir Kaliva and Lasse Koskinen Insurance Supervisory Authority Finland
Goal: Stock Market Risk Modelling in Long Horizon • Phenomenon: Stock market bubble • Model should work from one quarter to several years • Prices should be mean reverting • Fundament: Dividend / Price – ratio • Explanatory factor: Inflation • Usage: Risk Assessment and DFA
Background • Theory: Gordon growth model for dividend Dynamics: Campbell et al, also near Wilkie • Dividend-price-ratio (P/D) time-varying, stationary =>Mean reversion in stock prices Inflation expectation: Modigliani and Cohn (79) • Statistical model: • Logistic Mixture Autoregression with exogenous variable (Wong and Li (01)) • Conditional (dynamic) on P/D -ratio
Data • U.S. quarterly stock market (SP500) and inflation series; Log returns and dividens • Prices and dividends • Period: 1959 –1994 • Structural breaks in dividend series and price/dividend –series in 1958 and 1995 • 1995- 2001 – share repurchases and growth strategies won popularity
Final Model Structure • Two state (S(t)) regime-switching model: If S(t) = 1: Δ p(t) = a1 + e1(t), (RW) If S(t) = 2: Δ p(t) = a2 – by(t-1)+ e2(t), causes mean reversion - e1(t) ∼N(0,σ1), e2(t) ∼N(0,σ2), - y(t) = dividend/price -ratio • State hidden: Prob{ S(t) = 1} = F( f(inflation) ); F is normal distribution, f is a function
Statistical Model for Dividend and Inflation • Dividend: AR(2)-ARCH(4) –model - Dividend is the driving factor. • Inflation: AR(4) –model where dividend is explanatory variable - Note! This is just statistical relation, not causal. See fig on cross-correlation!
Price Dynamics Log-Likelihood method results in the following significant relation: S(t) = 1: Δ p(t) = 0.027 + e1(t) S(t) = 2: Δ p(t) = 1.078 – 0.357y(t-1)+ e2(t), - e1(t) ∼N(0,0.052), e2(t) ∼N(0,0.077) • Return distribution conditional: State S(t) and y(t) = log(P(t) /D(t))
Model Testing • The model is compared to 1) more general and 2) linear alternatives: - More general LMARX (that include standard RW and more complicated models) is rejected at 5 % level - Information criterion AIC and BIC select the nonlinear model instead of linear one
Model Diagnostic • Quantile (QQ) –plot shows: - Normal distribution assumption for the residuals of the linear model is wrong (fig) • Quantile residual plot shows: - Excellent fit for LMARX See fig. (Can see that it is not from normal distribution?)
Prob{S=2 } as a function of inflation- High inflation is tricker for state-switch
Intrerpretation • Model operates much more often in state 1 than in state 2; that is RW is a good description most of the time • E(Δ d) = 0.014 < 0.027 = E(RW | S =1). => process generates bubbles => switch from S=1 to S=2 causes a market crash, since b < 0 (b is the coefficient of log(P(t) /D(t)) in state 2) => process is mean reverting
UK – data (not in the paper) • Overfitting is a danger especially when nonlinear model is used => We tested also the UK -data =>The model structure remains invariant (heteroscedastic residuals)
Risk Assessment • The proposed model has shape-changing predictive distribution • Shape depends on - prediction horizon - inflation - P/D –ratio => Risk is time-varying
1-year Predictive Distribution.Log(P/D): a) low 3.2 b) high 3.8
1-year Predictive Distribution.Log(P/D) is 3.8, Inflation 4 %
5-year Predictive Distribution.Log(P/D) is 3.8, Inflation 4 %
10-year Predictive Distribution.Log(P/D) is 3.8, Inflation 4 %
Present Situation • Good: Stock market risk is much lower than in 2000 • Bad: P/D –ratio still high in the U.S.