Dynamic Model
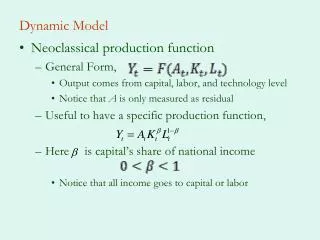
Dynamic Model. Neoclassical production function General Form, Output comes from capital, labor, and technology level Notice that A is only measured as residual Useful to have a specific production function, Here is capital’s share of national income

Dynamic Model
E N D
Presentation Transcript
Dynamic Model • Neoclassical production function • General Form, • Output comes from capital, labor, and technology level • Notice that A is only measured as residual • Useful to have a specific production function, • Here is capital’s share of national income • Notice that all income goes to capital or labor
Dynamic Model (cont.) • It is useful to think about output per worker • In per-worker terms, • Or • Graphically, we have
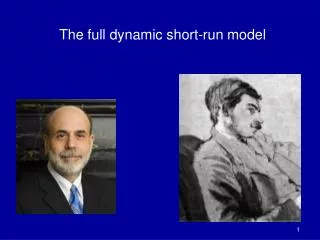
Dynamic Model (cont.) • Agents live two periods, • Save and work when young, spend when old • What do agents earn? • If markets are competitive w = marginal product of labor • Given our production function, this is • Notice that wages rise when k increases but less than proportionally
Capital • What about the return to capital? • If markets are competitive, then the r equals the marginal product of capital: • Notice that as k rises r falls. This is just diminishing marginal productivity • Notice that a rise in A (whatever that is) raises both wages and the return to capital • So it is good!
Accumulation • Assume that savings is proportional to wages • Simplifying assumption – (shouldn’t it depend on r?). Let be the fraction of income that is consumed • So savings is: • Assume 100% depreciation each period, so the capital stock in t+1 is equal to savings in t • But we know w just depends on k!!!!
Transition Equation • Using the expression for wages, • This is the transition equation • Capital stock in t+1 is a function of capital stock in t • notice that a higher capital stock today means more next period, because it leads to more income and savings, • Notice also, that there are diminishing returns (since β < 1)!!!! • => we eventually reach steady state equilibrium
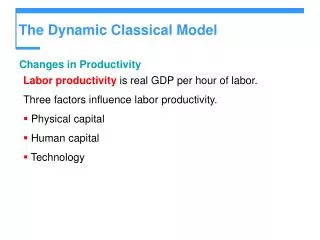
Steady State Equilibrium • Steady state equilibrium k is constant • Hence y must be constant • Capital and labor grow at same rate • If k is constant so is r and w • Unless A is growing over time, y constant in steady state • Only growth is adjustment to steady state • “Catch Up” growth
Steady State • We can determine the steady state level of k • Set in the transition equation so, or,
Steady State: Implications • From this expression it is clear that and hence • Increase if the savings rate rises (obvious) • Increases if A increases (obvious) • Increases if capital’s share increases • Example:
Steady State • Notice that if the capital-labor ratio is initially below its steady state value then savings leads to increases in the capital labor ratio. • Similarly, if we start off with too high a capital stock, we decumulate until we reach . • Notice that at , however, savings is just sufficient to keep the capital-labor ratio constant. • There is no net savings or net investment at this value of the capital labor ratio. • If A or the saving rate increases, so does
Two Countries • Consider two countries, US and Japan • Japan has higher savings rate • Then Japan has higher steady state capital-labor ratio, and higher output, savings, and consumption • In autarky this difference would be permanent
Open capital markets • With open capital markets, Japanese savers will want to invest in US. Why? • Because initially Japan had higher k and we know that r is inversely related to k • As Japan invests in US, rises, and falls • This continues until returns are equalized, but this requires • Graphically,
New Steady State • In new steady state wages will also be equalized • Capital-labor ratios in each country converge to world steady state capital-labor ratio • In Japan from above, in US from below. Hence, • Per-capita income rises in US in the transition • Per-capita income falls in Japan in the transition • But Japanese investors earn returns on their investment in the US • And we know this has higher return
How is determined? • Factor-price equalization makes world like one country • Let N be the population, and a assets. • So sum world savings and divide by population • Then, • World transition equation simplified by factor-price equalization • Implies wages equalized
Determination of • World capital accumulation depends on the world savings rate, which is the weighted average of those in each country: • So • In the new steady state the capital-labor ratio for each country will be equal to
Steady State Equilibrium • If this were not the case then the return to capital would differ in the two countries. • Since the US saves less than Japan this means that some of the savings required to have a capital-labor ratio equal to will have to come from Japan. • Thus Japan will have positive net foreign assets, and the US will have negative net foreign assets.
Benefits of Capital Mobility • Assume Japan and US same size and same production function • Under autarky, , due to different savings rates • Now open capital markets • Capital flows to US due to higher rates of return • New steady state where returns are equalized • Clearly yUS rises, what about Japan? • Capital is more productive in US, so Japan earns more too • Return BC > BG (return on using the capital at home) • US pays FD to Japan but earns DA on the net inflow
Problem: What if Congress forbids foreign ownership? • Suppose we start in equilibrium, then Congress forbids foreign ownership • Initially, we are at so interest rates equal • New law shifts US to its transition curve • Off the world curve • Asset accumulation now lower in US • In new steady state we have • <
Who gains, who loses? • Given lower k in US • wages lower in US (higher in Japan) • So young and future workers lose • What about interest rates? • rUS will be higher • So first old generation wins • Opposite is true in Japan • So winners and losers, but we know aggregate losses exceed gains
Adjustment to the new Steady State • Start from autarky, then open capital markets • Investment flows to US from Japan • So along the transition path US accumulates k • Implies current account deficit • In new steady state higher capital-labor ratio • But how do we get there?
Adjustment • Transition involves an increase in US k • Import of capital as returns are higher until new steady state is reached • implies negative current account in transition • Definition of current account • In steady state, investment = 0 • In steady state, current account = 0 • Net Exports is positive in steady state:
In New Steady State • Net foreign assets are lower (more negative) • US borrowed to accumulate k • Net interest payments are negative • Current account balance = 0 • Net exports are higher • Capital-labor and per-capita income are higher
Rise in Productivity • Suppose initially that • Now let • Transition curve for US shifts upwards • So now must rise • Japanese savers want to invest in US • Interest rates can be equalized only if rises • So in Japan and opposite in US • Or,
Digression (for now) • If interest rates are equalized why doesn’t k flow from rich to poor countries? • India has 1/5th of US per-capita income • Suppose that • (textbook calls this the “naïve” model • This implies • This would seem to imply huge differences in r • If capital’s share = 0.4 implies our k is larger than India’s
Return difference • Naïve model =>return to kUS is 58 times higher in India • Where does the 58 come from? • Ignoring A, and • So • We know that • So • And 151.5 = 58
Lucas Paradox • Capital should flow from US to India • But it flows the other way • Naïve model does not seem to work. Why? • Ignoring differences in A! • Ignoring risk premia • Emerging markets must earn extra return to compensate for risk
Implications • Rise in productivity causes US CA deficit • Japan has to accumulate foreign assets • Both countries benefit from higher US productivity • Rise in productivity is one explanation of US current account deficit, at least in 1990’s • Less valid in this century