Download

1 / 24
240 likes | 262 Vues
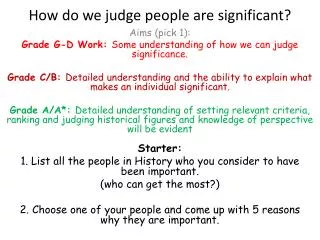
This graph displays the polling data of major political parties before and after debates in a small European country’s election. Analyze the graph to identify the changes and patterns.

E N D
Introduction We are testing how people view graphs. First, here is a bit of background information about your graph.
Introduction In the months before the elections of 2014 in a small European country, a polling organization asked citizens about their voting intentions on a daily basis. The major parties were: Labour Conservatives Alliance United The parties held several debates within this time, and the performance of the candidates had large impacts on each party’s popularity.
The major news story from this election was the fighting between the candidates from the leading parties: the Labourand the Conservatives. Labour Conservatives Alliance United Cairo Kosara Voters are most interested in news about these two parties, because there was little chance that either of the other parties would generate enough support to win.
Labour Conservatives Alliance United Cairo Kosara Cairo, the Labourcandidate, initially had a healthy lead in the polls, but during an initial debate, Cairo made a major error – he blatantly insulted Kosara’s spouse, suggesting that she wasn’t very bright.
Labour Conservatives Alliance United Cairo Kosara It backfired. By the next morning, Kosara was running attack ads on television, simply replaying the insult for voters, and asking whether the people wanted such a cruel man as their president. Cairo turned many voters over to Kosara.
Labour Conservatives Alliance United Cairo Kosara In a later debate, their fortunes again reversed. During a heated moment on controversial limitations on freedom of the country’s press, Cairo challenged Kosara on his inconsistent policies: he seemed to like press restrictions for organizations that disagreed with his beliefs.
Labour Conservatives Alliance United Cairo Kosara Kosara seemed unprepared for this attack, and looked lost. He tried to switch the topic to Cairo’s insult toward his wife, and it backfired massively, giving him the appearance of avoiding real issues. Cairo took a strong lead again.
Labour Conservatives Alliance United Cairo Kosara So to summarize, Cairo was initially strongly ahead, until his accidental insult led to a loss of voters. But at a later debate, Cairo took his strong lead back when Kosara tried to raise the stale story once again.
Cairo Kosara Labour Conservatives Alliance United This graph shows polling data from the election, so that you can see the impact of these debate events for yourself. You can see in that Cairo’s party was initially strongly ahead, until his accidental insult on April 21 decreased his position drastically, turning many voters over to Kosara.
Cairo Kosara Labour Conservatives Alliance United But on May 20, you can see where Kosara’s attempt to bring up the issue again backfired, and put Cairo back in the lead.
We’d like to see how well crowdsourcing can be used to predict what features, changes, or patterns people will see in these kinds of graphs. We plan to show the same graph that you saw to 100 people, along with the short description below. We won’t have time to show them the longer description that you will read – we just want you to have a sense of where the data come from.
In the months before the elections of 2014 in a small European country, a polling organization asked citizens about their voting intentions on a daily basis. The graph below reflects each party’s popularity over a three-month period. Labour Conservatives Alliance United
We’ll ask them to notice which features, changes, or patterns are most salient to them in the graph.
If you asked someone to describe the most salient features, changes, or patterns in these data, what would they say? In what priority order? Press “Next” when you are ready to write down your predictions. Labour Conservatives Alliance United
What is the 1st thing you predict that person will notice? Labour Conservatives Alliance United
What is the 2nd thing you predict that person will notice? Labour Conservatives Alliance United
What is the 3rdthing you predict that person will notice? Labour Conservatives Alliance United
What is the 4th thing you predict that person will notice? Labour Conservatives Alliance United
What is the 5th thing you predict that person will notice? Labour Conservatives Alliance United
Please take one minute to type your five statements in the box below. Labour Conservatives Alliance United
Please rank the following statements (A, B, C, D, and E) to match your written ranking, as best as you can, by dragging the statements in the right order. Do not change your answers from what you wrote and typed! • If you didn’t write a particular statement down, rank it at or near the end. • If there is something that you wrote that isn’t available here, we’ll give you a chance to type it in later. Press >> to continue to the ranking Labour [A] Labourlost ground to the Conservativesaround April 21 [B] Labourregained the strong lead fromConservatives around May 20 Conservatives Alliance United [D] United swapped position withAlliance, around June 17 [E] Labourand Allianceseem to be vertical mirror-images of each other. [C] Alliance dropped below United around May 25
Labour [A] Labourlost ground to the Conservativesaround April 21 [B] Labourregained the strong lead fromConservatives around May 20 Conservatives Alliance United [D] United swappedposition with Alliance, around June 17 [E] Labourand Allianceseem to be vertical mirror-images of each other. [C] Alliance dropped below United around May 25