Analyzing Sea Level Rise Data for Future Predictions
Explore the sea level increase trend since 1888 and predict future rises using scatter plots and trend lines. Calculate sea level rise by various years and understand the impact of global warming.

Analyzing Sea Level Rise Data for Future Predictions
E N D
Presentation Transcript
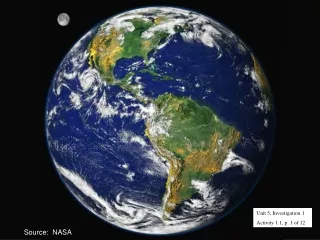
Source: NASA Source: NASA Unit 5, Investigation 1 Activity 1.1, p. 1 of 12
Unit 5, Investigation 1 Activity 1.1, p. 2 of 12 Sea Level Rise The table shows the annually averaged change in the sea level since 1888. Many believe that this increase is due to global warming. Let x be the number of years since 1900. Source: The original data for this table is from the Permanent Service for Mean Sea Level (PSMSL). Hubbard Glacier, Alaska, June 2005
Unit 5, Investigation 1 Activity 1.1, p. 3 of 12 Sea Level Rise If this trend continues, predict how much the sea level will have risen by 2010 and 2020. Hubbard Glacier, Alaska, June 2005
One approach to making our prediction is to graph the data in the table to determine if there is a trend. Unit 5, Investigation 1 Activity 1.1, p. 4 of 12
How can we effectively use this scatter plot to make our predictions? Unit 5, Investigation 1 Activity 1.1, p. 5 of 12
How do we use the trend line to help us make our predictions? Unit 5, Investigation 1 Activity 1.1, p. 6 of 12
Unit 5, Investigation 1 Activity 1.1, p. 7 of 12
Find the equation of the trend line. Unit 5, Investigation 1 Activity 1.1, p. 8 of 12
Unit 5, Investigation 1 Activity 1.1, p. 9 of 12
Use the equation to predict how much the sea level will have risen by the year 2010 and the year 2020. Unit 5, Investigation 1 Activity 1.1, p. 10 of 12
Unit 5, Investigation 1 Activity 1.1, p. 11 of 12
Use the equation to predict by which year the sea level will have risen 23 centimeters since 1888. If this trend continues, by 2036, the sea level will have risen 23 centimeters since 1888. Unit 5, Investigation 1 Activity 1.1, p. 12 of 12