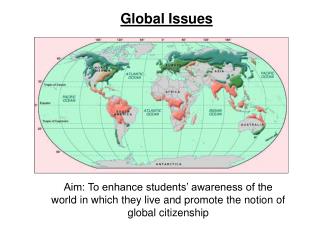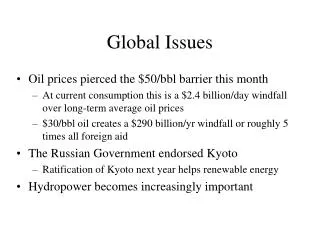
Global Issues
Explore the history and impact of CO2 emissions, transportation, and car culture on U.S. pollution levels. Learn about the rise of automobiles over rail travel, the environmental consequences, and the debate on reviving passenger rail systems. Are high-speed trains the future solution? Discover how post-Industrial Revolution prosperity led to a booming economy but also contributed to environmental challenges. Find out about current initiatives like light rail systems and the potential shift towards more sustainable transportation options.

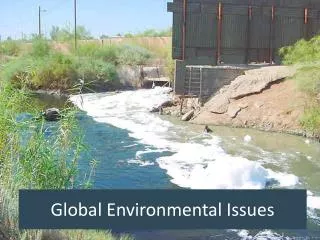
Global Issues
E N D
Presentation Transcript
A Quick Refresher… • What is the United States’ single greatest pollutant? • What is the primary source of this pollution? • When did it become this way? • 1. CO2 • 2. Electricity (made from coal, oil, and natural gas) and Transportation • Post-Industrial Revolution
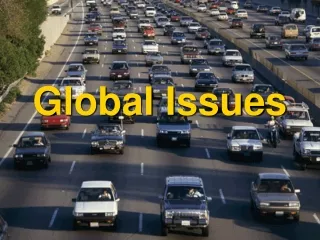
U.S. Sources of Pollution CO2 Cars
Kms of Roadways Rank Country Roadways (km) Date World 64,285,009 2013 • U.S. 6,586,610 2012 • India 4,689,842 2013 • China 4,106,387 2011 • Brazil 1,580,964 2010 • Japan 1,210,251 2010 • Russia1,283,387 2012 • Canada 1,042,300 2008 • France 1,028,446 2010 Source: CIA World Factbook
But why so many cars in the U.S.? • Large land area • Large population • American Culture: Individualism • Fordism: • Led to the domination of the Auto Industry in the early 20th century • History of affordable gas Prosperity through mass production and mass consumption: Assembly Line = Affordability ?
Netherlands ($7.73) U.S. ($3.37) 11/13/14 http://www.eia.gov/countries/prices/gasolinewithtax.cfm
U.S.: Railroads used to be #1! • Most dominant form of transportation in the U.S. until after WWII • However, by the end of WWII, gas was cheap and so were cars • “Everyone can have a car in their driveway for $500”—Henry Ford • With economic boom after the war, people had the $$$ for a car…and a house. • But is there more to the story?
“The Streetcar Conspiracy” • 1921:General Motors lost $65m • 90% of all trips taken by rail • Only 1 in 10 Americans owned a car • 15 billion rail passengers per year • Most towns of over 2,500 had a rail system • GM formed a new conglomerate composed of: • General Motors • Firestone Rubber Co. • Standard Oil Co. • Phillips Petroleum John D. Rockefeller (Standard Oil)
National City Lines • New Company Created: National City Lines • National City Lines was to “buy out” 100 major rail lines from 1936-1950 • Through a variety of means, National City Lines “persuaded” the railroads to convert their trains to buses • National City then dismantled and decommissioned the trains and rails • U.S. Highway System began in California—first place where railroads were bought • End of the railroad era in the United States
However… • Many believe National City Lines came in after the trolley and rail system was already in trouble • Great Depression • Case went to court in 1948: • GM found guilty of conspiracy • GM had to pay a fine of $5,000
North Shore Line: Chicago to Milwaukee • GM helped acquire and dismantle the $50 million North Shore Line • Was the fastest electric service in the world • Milwaukee to the Loop • However, was in dire financial straits (had filed bankruptcy several times) • GM also purchased and scrapped the street railways serving Minneapolis-St. Paul.
Rail Passenger Miles (Country) Rank Country Bn passenger-kms Year 1. China 662.20 2006 2. India 575.70 2005 3. EU 352.74 2005 4. Japan 245.96 2005 5. Russia 164.26 2005 6. France 79.94 2006 7. Germany 74.73 2006 8. Ukraine 52.66 2005 9. U.K. 46.762006 10. Italy 46.44 2005 24. U.S. 8.66 2006 http://www.nationmaster.com/encyclopedia/Rail-usage-statistics-by-country
How does this figure? Freight rail by billions of tonne-kilometers Rank Country Bntonne-kms Year 1 U.S. 2717.50 2005 2 China 2195.40 2006 3 Russia 1852.91 2005 4 India 407.40 2005 5 EU 359.12 2005 6 Canada 352.07 2005 7 Ukraine 223.98 2005 8 Brazil 221.60 2005 9 Kazakhstan 171.86 2005 10 South Africa 108.51 2005 11 Germany 89.69 2006 http://www.nationmaster.com/encyclopedia/Rail-usage-statistics-by-country
Questions… • Is it too late to revive the railroad? Should we revive the railroad? • Every other highly populated core country has a significant passenger railroad system—not us. • Would you use a rail system if one were to become available? • Railroadvs. taxis: MSP to downtown $2.00 $36.00 • More ecologically friendly and cheaper
Minneapolis Minnesota’s first light-rail line opened in 2004 Length:Now 21 mi., connecting downtown St. Paul, the U of M, downtown Mpls, MSP Int’l Airport and the Mall of America. Ridership:2014: New line just opened; already exceeding predictions for 2015 and growing. Future: New route to SW suburbs Notes: $81.9m Hennepin County taxes to county road repair in ‘10. $12.7m to train. Car Train Per user taxes: $7.58 $1.20 http://www.metrocouncil.org/Transportation/Projects/Current-Projects/Central-Corridor/Publications-And-Resources/Miscellaneous-Documents/Metro-Green-Line-Fact-Sheet.aspx
Other Trains? http://volumeone.org/news/1/posts/2014/11/07/8004_chugging_forward_local_train_service_on_minnesotas
High-Speed Rail • Competes with airlines in Europe, Japan • Fewer delays, easier through security • More eco-friendly • Airport hassles: more likely to catch on? • Or same old story?
Back to cars… • Post-WWII: U.S. economy BOOMING! • Women in the workforce: no longer only option being the “farmer’s wife” • People making $$$ = More demand • More demand = More production • More production = More people moving off the farm and into the city • But cities were dirty, cramped • Birth of suburbia
Not only was the economy booming… • More people = More resources “Baby Boom”
Suburbanization • A new “neighborhood” • City conveniences without the city • Led to the decline of the city • Loss of “neighborhood” / community • More individualistic • Automobile dependent (shopping, banking, school, etc.)
Conflict: Urban Sprawl vs. the Environment • Encroachment into Wilderness • - Animal conflicts • Plants conflicts • Environmental Impacts • Water Pollution / Depletion • Overwatering of land (Las Vegas grass ban) • Golf courses: chemicals • Depletion of aquifers • Wetland / natural habitat destruction • Smog / Pollutants from vehicle emissions • Lack of exercise (car)
Las Vegas • One of the fastest growing cities in the U.S. over last 10 years…until recently • What is its carrying capacity? • Where would Las Vegas be without extreme non-ecological efforts to support the city? • One of the most ecologically “wrong” cities in the world (and Phoenix)
Dubai: World Islands Palm Islands
Hoover Dam • In today’s $$$, would cost approximately 2/3 of a billion $$$! • Supplies power to SoCal, NV, AZ, elsewhere • Lake Mead created from damming Colorado River • Without dam, Las Vegas and L.A. could not exist as they do • Is that good or bad?
Eau Claire? Which is more “G.C.?” Las Vegas
Fastest Growing Metro Areas (U.S.) 2012 Electoral College Map Carrying Capacity?
Vienna Amsterdam Dublin Rome
Chicago CTA Map 2nd to last line added: 1984 (O’Hare Airport) Last line added: 1993 (extension to Midway Airport)
San Juan (Puerto Rico)Urban Train Map ? Only Red Line has been completed!
U.S. Airports with train connections NO • Boston (bus to rail) • Denver (bus to rail) • L.A. (bus to rail) • New York (bus / tram to rail) • Memphis (bus to rail) • New Orleans (bus to rail) • Pittsburgh (bus to rail) • Sacramento (bus to rail) • San Diego (bus to rail) • Washington D.C. (Dulles-bus to rail) • Milwaukee • Austin, TX • Charlotte, NC • Cincinnati • Columbus • Cleveland • Detroit • Dallas • Honolulu • Houston YES • Washington D.C. (1977) • Baltimore (1980) • Chicago (1984, 1993) • Philadelphia (1984) • Atlanta (1988) • St. Louis (1998) • Portland, OR (2001) • San Francisco (2003) • Minneapolis (2004) • Seattle (2010) • Miami (2012) • St. Paul (2014) • Indianapolis • Kansas City • Las Vegas • Nashville • Oklahoma City • Orlando • Phoenix • Salt Lake City • Tampa
Why? The auto industry
Legacy of the Auto Industry • Because of the auto industry, we as Americans have certainly gained in our independence and individualism… • ...but we are also paying in many other ways: • Environmentally • Economically • Personal Safety • Politically? Jimmy Hoffa
Transportation Deaths:1999-2009 (NTSB) http://www.bts.gov/publications/national_transportation_statistics/html/table_02_01.html
Transportation Injuries:1998-2008 (NTSB) http://www.bts.gov/publications/national_transportation_statistics/#chapter_2
Death Ratesby Mode of Transportation (2006) Auto1.41 (per 100m VMT) Train .73 (per 100m PMT) Bus .59 (per 100m PMT) Plane .23 (per 100m PMT) Auto 16.99 (per 100,000 vehicles) Rec Boating 5.6 (per 100,000 vehicles) Source: U.S. Department of Transportation Federal Highway Administration (2008)
Rudolf Diesel(1858-1913) "The use of vegetable oils for engine fuels may seem insignificant today. But such oils may become in the course of time as important as petroleum and the coal tar products of the present time." After his death, the Diesel engine was marketed that it only ran on petroleum based products and his great ideas of a clean burning engine died with him.
Top 10 Ethanol Producing Countries (millions of gallons) C S C SB Rye W W W S Source: Renewable Fuels Association