Download
1 / 29
290 likes | 385 Vues
This research explores using Weighted Graph Drawing methods to visually represent attributes of web pages, improving user navigation and comprehension. Different mapping techniques such as static and dynamic methods are discussed, highlighting the importance of visualization in web structure analysis. Utilizing capabilities like focus+context and zooming+filtering, this study aims to address common web mapping challenges and provide users with valuable insights during web browsing.

E N D
Improving the Quality of Visual Web Browsing by Using Weighted Graph Drawing Mao Lin Huang Department of Computer Systems, UTS, NSW 2007, Australia.
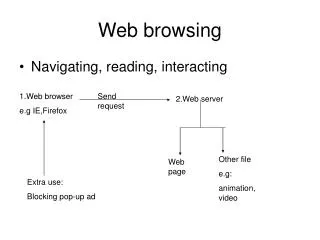
Abstract • Web Site Maps (static & dynamic) provide an on-line assistance for users to browse through the local web-spaces. • Visual Web Browser allows the user to graphically snoop the World Wide Web via a sequence of successive visual maps of web structure. • However, these techniques only focused on the problem of representing “hyper-documents” and “hyper-links”. They did not consider the problem of visually representing the attributes that are associated with the “hyper-documents” and “hyper-links”. • This research tries to use Weighted Graph Drawing methods to address the problem of visually representing the attributes of web pages, including the Connectivity, the Access Frequency and the Depth of a page in the web locality. • Thus, the user can gain the knowledge of importance of nodes while he/she is browsing through the web-space.
General problems of web structure • Web site maps provide an overview diagram of the contents of a web site. There are four main concerns that site maps try to address. • Disorientation • Absence of physical context • Lack of control over distributed sites • Cognitive overhead
Web site mapping techniques Since web site mapping is essentially visualization process of information content of a web site, various approaches are adopted based on human visualization and perception capabilities. Each approach or technique for web site mapping has adopted one or a combination of these capabilities hoping to exploit them to help the user in navigation and comprehending the contents
Web site mapping techniques • From the creation point of view, the web site mapping techniques could be categorized into two main approaches: • static mapping and • dynamic mapping.
Static mapping Static mapping Static maps are designed by studying the contents of the web site manually and then determining the grouping of web pages and giving them some pictorial or visual representation on the web site map. Once the map is prepared and installed it does not change until the web site administrator updates or changes it.
Web site mapping techniques 1D hierarchy
Web site mapping techniques 2D hierarchy
Dynamic Mapping Dynamic maps are produced "on the fly”. When users navigate the contents of a web site(s), the system automatically creates a sequence of maps corresponding to the contents of the web site. This makes it possible to always get the latest (most recent) version of the web structure for visualization. Dynamic mapping employs mathematical optimization techniques, artificial intelligence and heuristic algorithms to automatically determine the best possible visualization for the site map. A dynamic web site appears differently from time to time depending on the current contents of the web site, and the interest of a particular user. Example: http://sally.it.uts.edu.au/~maolin/gallery/tsakalo/map.html
Dynamic site mapping techniques • From visualization point of view, there are two categories of visualization techniques that can be used for dynamic web site mapping. They are • Focus + context • Zooming + filtering
Web site mapping techniques Focus + context (local navigation) The focus +context concept has some applications, such as fisheye view [Sarkar & Brown], bifocal view [Pilgrim et al. 96] and hyperbolic tree [Lamping et al. 1995]. It allows a user to view a small central focus in detail while maintaining the visibility of a large overall context or part of the overall context. WebCutter [Maarek et al. 97], WebMapper [11] are good examples of adopting "focus + context"concept for web site mapping.
Web site mapping techniques Zooming + filtering (local & global) The zooming + filtering takes the form of selecting a subset of the data along a range of numerical values of one or more dimensions. It works by reducing the amount of context in the display; this distinguishes them from the focus+context techniques, which attempt to retain all the contextual information even if it must drawn so small as to make it virtually invisible. WebOFDAV, ThinkMap, HotSauce and WebMapper are examples of adopting "zooming + filtering"concept for web site mapping.
Web site mapping tools MAPA's 3D map was developed by Dynamic Diagrams which implements site maps as Java applets. MAPA adopts the 2D/3D “hierarchical mapping" method to show the hierarchical view of a web site. It also uses "focus + context" concept to re-centering the site based on user's current focus.
Web site mapping tools WebMapper is developed by Netcarta. It creates a “hyperbolic” view [Lamping et al. 1995]of the web site outline. This graphic is a tree diagram modified by "fish-eye" view distortion Figure 4 WebMapper uses hyperbolic tree viewing that adopts both "focus + context" & "zooming + filtering" concepts for visualization. http://www.inxight.com/products_wb/ht_server/ht_server_demos.html .
Web site mapping tools ThinkMap is developed by Plumb Design. It has the application of “Visual Thesaurus” that accesses data from the WordNet database, a publicly available resource developed by the Cognitive Science Laboratory at Princeton University. 3D ThinkMap adopts a 3D/2D force-directed layout algorithm & "zooming + filtering" concept for visualizat. http://www.visualthesaurus.com/
Web site mapping tools This was part of my PhD work WebOFDAV adopts a force-directed layout algorithm & "zooming + filtering" concept for visualization. It produces maps "on the fly”can be used for global web navigation. http://www.cs.newcastle.edu.au/~mhuang/spring_fifo/spring.html
Problem ? However, these techniques described above did not show the importance of each node (web page) in the web locality. These visualization techniques did not show the attributes of nodes and edges, which are sometime very important to the user where surfing through the web.
Attributes associated with nodes & edges • Node (web page) • Connectivity (indegree & outdegree) • Access frequency • depth (position in the file system) • medium type (html, gif, mic,nls, msc) • Edge (web link) • HTTP link • FTP link • MAILTO link • ………
Metrics for measuring the importance of a node v in the web locality • Connectivity • The importance of a node could be reflected by the connectivity of the node. If a node is connected to more other nodes in the web space, then we say this node is to be more important in the web locality. To find out the connectivity of a node the hyperlink structure (the topology) among the web pages needs to be extracted. • We use two terms, outdegree and indegree to measure the connectivity of a • node. The outdegree of a node is the number of other nodes that can be directly • reached from this node with the graph theoretic distance of 1. Similarly, the • indegree of a node is the number of other nodes that can directly reach this node • with the graph theoretic distance of 1.
Metrics for measuring the importance of a node v in the web locality • Access frequency • The importance of a node could also be reflected by the access frequency of the node. This means that if a node (page) had more visitors in a periodical time, then we say this node is to be more important in the web locality. This information can be obtained by analysis of the log files. For each node we may calculate the number of times it was accessed in the preceding month. To keep the access frequency uptodate this process needs to be done periodically.
Metrics for measuring the importance of a node v in the web locality • Depth • The importance of a node could also be reflected by the position of the node in the hierarchical file system of a web site. Generally, when a web site is developed, the file system hierarchy is formed so that we assume that the important nodes are normally higher up in the hierarchy. For example, in the Faculty of Information Technology site at UTS, the top directory of the web site has the home page of the Faculty.
A weighted graph model A weightW() is a non-negative real value associated with a node of a graph. A weighted graph G = (V, E, W, W’) consists of a graph G = (V, E), a weight W() for each V, and a weight W’(e) for each eE. Each W() has a set of sub-weights, W() = {w1, w2, w3 …}, and similarly for each W’(e), we have W’(e) = {we1, we2, we3 …}.
Weighted graph drawing The traditional Graph Drawing concerns the problem of constructing geometric representationsof graphs. Most GD algorithms only concern the geometrical attributes of nodes and edges. They calculate the pixel coordinates (x, y) for each node , and a pair of coordinates (x, y) & (x µ, yµ) for each edge e (µ, ). Obviously, the pure geometric drawing D is no longer appropriate for representing this kind of weighted graphs. We need to employ more graphic properties to visually represent this kind of weighted graphs.
Weighted graph drawing A weighted drawing of a graph G = (V, E, W, W’) is not only a geometrical function D: V R2 that associates a drawing D() to each node V, but also a visual function P: V Rm that associates a pictorial representation P() to each node V. Here m is the number of the graphic properties that could be applied on the visual object (rectangle) of . Similarly, for each edge e E, we may have a geometrical drawing D(e) and a pictorial representation P(e).
Graphic Properties Nodes - size of the graphic entity - background color - shape of the nodes - brightness - highlight/shadows - Z-coordinate at overlaps - …. Edges - length - thickness - brightness - Z-coordinate at crossings - …...
Translation into Pictures hypertext relational structure representation page A1 A2 A3 Geometrical mapping x y geometrical structure representation node Visual mapping x y node v1 v2 v3 target pictorial representation The visualization model
Actual picture creation Weights Graphic properties nodeconnectivity node access frequency node depth node medium type http link ftp link mailto link ……… node-size node-color node-shape node-brightness node-highlight node-z-coordinate edge-length edge-thickness edge-brightness edge-z-coordinate …... w1 w2 many to many relations
Calculating graphic properties for nodes http://www-staff.it.uts.edu.au/~maolin/gd2001/test.html