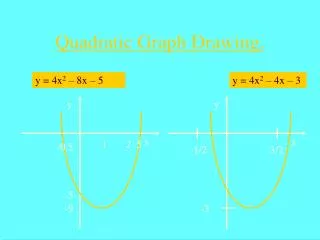
Quadratic Graph Drawing.
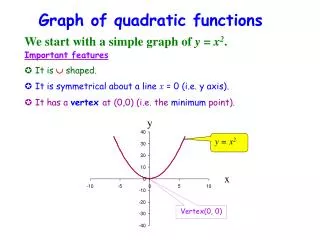
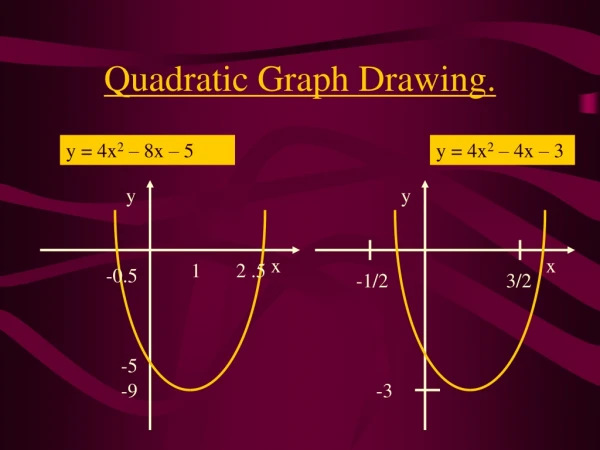
y. y. y = 4x 2 – 8x – 5. x. x. -1/2. 3/2. 1. 2 .5. -0.5. -3. -5. -9. Quadratic Graph Drawing. y = 4x 2 – 4x – 3. y. 2. x. 1. 3. Quadratic Graph Structure. Consider the typical quadratic graph shape below:.

Quadratic Graph Drawing.
E N D
Presentation Transcript
y y y = 4x2 – 8x – 5 x x -1/2 3/2 1 2 .5 -0.5 -3 -5 -9 Quadratic Graph Drawing. y = 4x2 – 4x – 3
y 2 x 1 3 Quadratic Graph Structure. Consider the typical quadratic graph shape below: To draw a quadratic graph you must be able to calculate all the points numbered on the diagram:
y 2 x 1 3 The significance of each point and the starting point to finding the point are given below: • Point of intersection with the y axis. “Graph cuts y axis when x = 0” (2) Point of intersection with x axis. “Graph cuts x axis when y=0” These are “the roots” of the equation. (3) Turning point of graph. Turning point x coordinate is the midpoint of the roots.
y x -3 3 -9 Graph Of Type y = x2 – a2 Sketch the graph of y = x 2 - 9 (1) Find the y axis intercept. Graph cuts y axis when x = 0 Point ( 0, -9 ) is on the graph. (2) Find the x axis intercept. Graph cuts x axis when y = 0. (x – 3 ) (x + 3 ) = 0 The points (3,0) and (-3,0) are on the graph. x = 3 x = - 3
y x -3 3 -9 (3) Turning point of graph. Y = x2 - 9 Turning point x coordinate is the midpoint of the roots. From the symmetry of the graph we can see that this point must be (0,-9). Now sketch the graph.
Example 2 y x -5 5 -25 Sketch the graph of y = x 2 - 25 (1) Find the y axis intercept. Graph cuts y axis when x = 0 Point ( 0, -25 ) is on the graph. (2) Find the x axis intercept. Graph cuts x axis when y = 0. (x – 5 ) (x + 5 ) = 0 The points (5,0) and (-5,0) are on the graph. x = 5 x = - 5
y x -5 5 -25 (3) Turning point of graph. Y = x2 - 25 Turning point x coordinate is the midpoint of the roots. From the symmetry of the graph we can see that this point must be (0,-25). Now sketch the graph.
y y Y = x2 - 4 Y = x2 - 36 x x -2 -6 2 6 -4 -36 What Goes In The Box ? 1 Sketch the graph of the following functions: (1) y = x2 - 4 (2) y = x2 - 36
y x -6 4 -24 Graphs Of Type y = ax2 + bx + c Sketch the graph of y = x 2 + 2x –24 (1) Find the y axis intercept. Graph cuts y axis when x = 0 The point (0,-24) is on the graph. (2) Find the x axis intercept. Graph cuts x axis when y = 0. (x + 6) (x – 4) = 0 The points (-6,0) and (4,0) are on the graph. x = - 6 x = 4
y x -6 -1 4 -24 -25 (3) Turning point of graph. y = x 2 + 2x –24 Turning point x coordinate is the midpoint of the roots. Substitute x = -1 into the equation y = x 2 + 2x –24 to find the y coordinate. y = (-1)2 +(2 x –1) – 24 = - 25 The point (-1,-25) is the minimum turning point. Now sketch the graph.
Example 2. y x -1/2 3/2 -3 Sketch the graph of y = 4x2 – 4x – 3 (1) Find the y axis intercept. Graph cuts y axis when x = 0 Y = – 3 The point (0,-3) is on the graph. (2) Find the x axis intercept. Graph cuts x axis when y = 0. ( 2x + 1 )( 2x – 3 ) = 0 The points (-1/2,0) and (3/2,0) are on the graph.
y x 1/2 -1/2 3/2 -3 -4 (3) Turning point of graph. y = 4x2 – 4x – 3 Turning point x coordinate is the midpoint of the roots. Substitute x = ½ into the equation y = 4x2 – 4x – 3 to find the y coordinate. y= - 4 Minimum turning point (1/2, -4) Now sketch the graph.
y y (2) (1) y = x2 – 2x – 8 y = 4x2 – 8x – 5 x x 4 1 2 .5 -2 -0.5 1 -5 -8 -9 -9 What Goes In The Box? 2 Sketch the graphs of the equations given below:
y 25 x Graph Of Type y = a2 – x2 Sketch the graph of y = 25 – x2 y = 25 – x2 (1) Find the y axis intercept. Graph cuts y axis when x = 0 y = 25 The point ( 0,25 ) is on the graph (2) Find the x axis intercept. 5 -5 Graph cuts x axis when y = 0. 25 – x2 = 0 ( 5 – x ) ( 5 + x ) = 0 The effect of the negative x2 is to make the graph “A” shaped. x = 5 x = - 5 The points (0,5 and (0,-5) are on the graph. Now sketch the graph.
y 6 -2 3 x Example 2 Sketch the graph of y = – x2 + x + 6 (1) Find the y axis intercept. Graph cuts y axis when x = 0 y = 6 The point ( 0,6 ) is on the graph (2) Find the x axis intercept. Graph cuts x axis when y = 0. – x2 + x + 6 =0 Divide throughout by -1 x2 - x - 6 =0 ( x – 3) ( x + 2 ) = 0 The points ( 3, 0 ) and ( -2 , 0 ) are on the graph. x = 3 x = - 2
y 6.25 6 -2 0.5 3 x (3) Turning point of graph. y = - x2 + x + 6 Turning point x coordinate is the midpoint of the roots. Substitute x = ½ into the equation y = - x2 + x + 6 to find the y coordinate. The maximum turning point is ( 0.5, 6.25 ) Now sketch the graph.
y y 8 (1) y = 36 – x2 (2) y = - x2 + 2x + 8 9 36 -2 4 x x 6 1 -6 What Goes In The Box ? 3 Sketch graphs of the quadratic equations below: