Tree and Graph Drawing
Tree and Graph Drawing. Jiun-Hung Chen Feb. 17, 2005. Outline. Tree Drawing Graph Drawing. Tree Drawing. Why Trees?. Hierarchies File systems and web sites Branching processes Genealogy and lineages Decision processes Decision trees and Tournaments. Two Major Representations.

Tree and Graph Drawing
E N D
Presentation Transcript
Tree and Graph Drawing Jiun-Hung Chen Feb. 17, 2005
Outline • Tree Drawing • Graph Drawing
Why Trees? • Hierarchies • File systems and web sites • Branching processes • Genealogy and lineages • Decision processes • Decision trees and Tournaments
Two Major Representations • Node-Link • Space Filling
Node-Link Diagram • Common: Root at Top and Leaves at Bottom
Classical Tree Drawing • How does one draw this? • DFS
Potential Problems • For top-down, width of fan-out uses up horizontal real estate very quickly • At level n, there are 2n nodes • Tree might grow a lot along one particular branch
3D Approaches • Add a third dimension into which layout can go • Children of a node are laid out in a cylinder “below” the parent • Siblings live in one of the 2D planes
Cone Trees Developed at Xerox PARC 3D views of hierarchies such as file systems Robertson, Mackinlay, Card ‘91
2D Hyperbolic Browser • Approach:Lay out the hierarchy on the hyperbolic plane and map this plane onto a display region. • Comparison • A standard 2D browser: 100 nodes (w/3 character text strings) • Hyperbolic browser: 1000 nodes, about 50 nearest the focus can show from 3 to dozens of characters Demo: http://www.inxight.com/
H3Viewer Munzner, ‘98
Centrifugal View Directions
Contents Fisheye View • Downward tree of contents rooted at the context “User JMZ”
Space-Filling Representation Each item occupies an area Children are “contained” under parent One example
Treemap • Space-filling representation developed by Shneiderman and Johnson • Children are drawn inside their parent • Alternate horizontal and vertical slicing at each successive level • Use area to encode other variable of data items
Internet News Groups NetScan Fiore & Smith Microsoft
Applications • Can use Treemap idea for a variety of domains • Basketball statistics • Image Browser • Stock Market • See how U.S. presidential candidates compare with previous Presidents.
Why Graphs? • Connections throughout our lives and the world • Circle of friends • Computer networks… • Relational databases with keys • … • Model connected set as a Graph
Applications • In information visualization, many applications • Subway routes • Social networks • Network analysis • Link analysis • Citation analysis • …
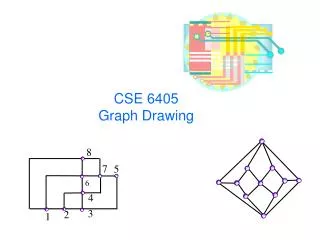
What is a Graph? • Vertices (nodes)connected by • Edges (links) Adjacency list 1: 2 2: 1, 3 3: 2 1 2 3 0 1 0 1 0 1 0 1 0 1 1 2 3 2 3 Drawing Adjacency matrix
V = {1,2,3,4,5,6} E = {(1,2),(2,3),(1,4), (1,5),(3,4),(3,5), (4,5),(4,6),(5,6)} Graph drawing A maze Layout by Tom Sawyer Graph Drawing • Find an aesthetic layout of the graph that clearly conveys its structure. • Technically: Assign a location for each node and a route for each edge, so that the resulting drawing is “nice”. • Find an aesthetic layout of the graph that clearly conveys its structure • Technically: Assign a location for each node and a route for each edge, so that the resulting drawing is “nice”
Graph Visualization Problems • Graph layout and positioning • Make a concrete rendering of abstract graph • Scale • Not too much of a problem for small graphs, but large ones are much tougher • Navigation • How to support user changing focus and moving around the graph
Conflict Minimize edge crossings Maximize symmetry Aesthetic Criteria • Minimize edge crossings • Minimize area • Total edge length • Maximum edge length • Uniform edge length • Total bends • Maximum bends • Angular bends • Aspect ratio • Symmetry
Layout Algorithms • Topology-Shape-Metrics • Hierarchical • Force-directed
Topology – Shape – Metrics • Planarization • the graph is converted into a 2d drawing where the number of crossings are kept to a minimum. • Orthogonalization • the bends are made to go at right angles and the vertices are aligned. • Compaction • the dummy vertices are removed and the graph is made to take up a minimum amount of area
Hierarchical • Layer Assignment • Each vertex is assigned a layer L, such that if there is an edge from u to v, u and u’s layer is Li and v’s layer is Lj, then i<j. If there is a gap in between layers, such as when there is an edge from L1 to L3, a dummy vertex is placed at L2 • Crossing reduction • the amount of times that edge cross over is reduced to create a more aesthetically pleasing drawing. • X-coordinate assignment • In this stage, all the points are assigned a position (x-coordinate), the dummy vertices are removed, and the edges are all drawn. In this stage many different aesthetics can be stressed such as minimizing bends or minimizing area.
Force-directed • An energy model is associated with the graph • Ex: A spring model. (Repulsion + Attraction) • In a force model, the force produced is directly proportional to the distance between the vertices that make up the edge. • Low energy states correspond to nice layouts • Hence, the drawing algorithm is an optimization process Initial (random) layout Final (nice) layout Iteration 1: Iteration 2: Iteration 3: Iteration 4: Iteration 5: Iteration 6: Iteration 7: Iteration 8: Iteration 9: Demo: http://www.touchgraph.com/
Other issues • Vertex • Shape,Color, Size, Location, Label • Edge • Color, Size, Label, Form • Scale • Run out of space for vertices and edges, slow down algorithm • Often use clustering to help • Extract highly connected sets of vertices • Collapse some vertices together
1981 http://www.mpi-fg-koeln.mpg.de/~lk/netvis/trade/WorldTrade.html
Summary • Tree and Graph Drawing • Important and useful tools for many applications • Interesting and important research directions • Large-scale, dynamic and efficient visualization
Reference • http://www.cc.gatech.edu/classes/AY2002/cs7450_spring/ • http://graphics.stanford.edu/courses/cs448b-04-winter/lectures/treesgraphs/tree.graph.pdf • http://www.cs.brown.edu/people/rt/papers/gd-tutorial/gd-constraints.pdf • http://www.cs.umd.edu/hcil/treemap-history/ • http://davis.wpi.edu/~matt/courses/graphs/