Ocean circulation
Ocean circulation. Surface circulation driven by wind Subsurface circulation driven by density. Surface wind patterns, annual avg. Wind flowing over water creates friction or drag; this creates water flow, or currents.

Ocean circulation
E N D
Presentation Transcript
Ocean circulation Surface circulation driven by wind Subsurface circulation driven by density
Surface wind patterns, annual avg. Wind flowing over water creates friction or drag; this creates water flow, or currents
The major ocean surface currents are driven by winds. Thus, the trade winds create east to west flowing currents. The Prevailing Westerlies produce west to east flowing currents. Unlike the atmosphere, the flow of water is constrained by the position of land masses- only around Antarctica do they circle the globe. The current “loops” are termed gyres.
Wave height in feet over a 12 hour interval, April Southern hemisphere autumn
Ocean surface elevation, 10 day avg (october); reds are highs and greens and blues are lows. (data from TOPEX/Posiedon satellite). Water piles up in the western sides of ocean basins because of current directions, or gyres, that “run into” land, deflecting the water north
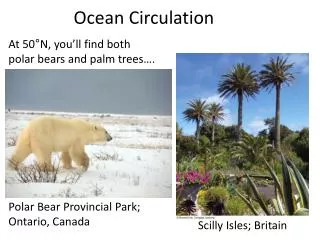
Infrared photo of the Gulf Stream. Note how it loses heat ~latitude of NY; note cold water descending from the north along Nova Scotia-Maine We recognize “water masses,” or bodies of water that have characteristic densities due to their temps and salinities. The Gulf Stream is a water mass. The Gulf Stream water becomes cooler east of NY, but it continues to flow across the ocean to bathe the British Isles, moderating temps so palm trees can grow in England
Surface ocean currents are important for moving heat on the Earth’s surface and they also control the distribution of marine organisms. The larvae of most marine invertebrates are carried by ocean currents and control marine biogeography. Map of marine diversity shows that species common to Indonesia also occur throughout the south pacific islands as a function of the ocean currents (Equatorial Counter Current) that transport larvae.
Let’s examine some plate reconstructions through geologic time, apply basic principles, and predict what surface ocean currents would be.
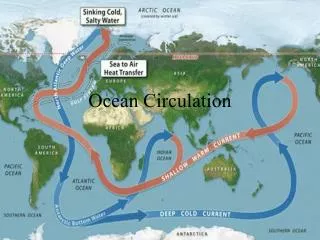
Surface currents are only a small part of the story: ocean water sinks and rises in the ocean basins, and flows as a function of density: thermohaline circulation
Average profiles of salinity (left) and temp (right) vs depth in the oceans. The regions where these values change rapidly are termed the “halocline” and “pycnocline,” respectively. The density stratification of ocean water explains why cold water sinks, as does highly saline water.
SST https://www.fnmoc.navy.mil/PUBLIC/NCODA/ncoda.html
Cold, dense water flows south from the Arctic Ocean into the North Atlantic. Due to its cold temp it sinks and flows south along the sea floor.This is called “thermohaline circulation”because it is density driven, and density is controlled by temp and salinity
A view of the globe showing the complex flow of water in the Atlantic: surface flow of the Gulf Stream and bottom flow of the North Atlantic Deep Water (NADW)
Another view of the NADW, this time in a cross section view through the Atlantic Ocean. Note the cold, dense Antarctic Bottom Water (AABW) that sinks and flows northward. You can see that the oceans are stratified with different water masses
Thermohaline circulation (superimposed on surface winds), april
This diagram shows that flow from the North Atlantic continues into the South Atlantic and beyond - into the Indian and Pacific Oceans. Equatorial heat is carried towards the poles, sinks and travels south, ultimately warming up, rising and flowing on the surface. Thus, the oceans move much heat over the Earth
This diagram is similar to the previous one, but shows the complexity of circulation in the Indian and Pacific Oceans. Cold bottom water from the Atlantic flows at depth around Antarctica but some flows into the Indian & Pacific Oceans where it mixes with warm but saline (=dense) water from equatorial heating.
A short movie that shows illustrates thermohaline circulation based on a tracer that enters the north Atlantic. Watch the movie AT LEAST 3 times, focusing first on the distribution of the tracer in surface, then mid- level and final deep water depths. The brighter yellows and reds reflect higher concentrations http://web.maths.unsw.edu.au/~alexg/nadwaaiw.htm
Among the things you should notice when you watch this movie are: (1) the rate at which water flows in the 3 different depths is totally different. The tracer moves south faster at depth than at the surface. (2) dilution happens faster in surface water than at depth, in other words, water masses at depth retain their character for longer than surface waters.
Only recently have Earth scientists come to appreciate the role that thermohaline circulation plays in controlling global climate • Thermohaline circulation IS the 3 dimensional “heat pump” that moves warm water northward and cold water southward at depth. • There is no more important process in determining how global climate will change as a result of global warming • The other major factor: astronomical variables: the Milankovitch Effect
Upwelling and downwelling zones (superimposed on surf winds)