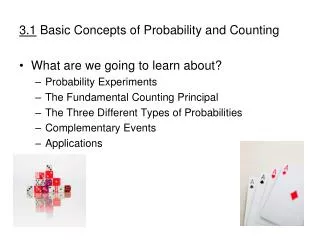
3.1 Basic Concepts of Probability
3.1 Basic Concepts of Probability. Statistics Mrs. Spitz Fall 2008. Objectives/Assignment. How to identify the sample space of a probability experiment and to identify simple events. How to distinguish between classical probability, empirical probability and subjective probability.

3.1 Basic Concepts of Probability
E N D
Presentation Transcript
3.1 Basic Concepts of Probability Statistics Mrs. Spitz Fall 2008
Objectives/Assignment • How to identify the sample space of a probability experiment and to identify simple events. • How to distinguish between classical probability, empirical probability and subjective probability. • How identify and use properties of probability. • Assignment pgs. 111-113 #1-26 all
Definitions • Probability experiment: An action through which specific results (counts, measurements, or responses) are obtained. • Outcome: The result of a single trial in a probability experiment. • Sample Space: The set of all possible outcomes of a probability experiment • Event: One or more outcomes and is a subset of the sample space
HINTS TO REMEMBER: • Probability experiment: Roll a six-sided die • Sample space: {1, 2, 3, 4, 5} • Event: Roll an even number (2, 4, 6) • Outcome: Roll a 2, {2}
Identifying Sample Space of a Probability Experiment • A probability experiment consists of tossing a coin and then rolling a six-sided die. Describe the sample space. • There are two possible outcomes when tossing a coin—heads or tails. For each of these there are six possible outcomes when rolling a die: 1, 2, 3, 4, 5, and 6. One way to list outcomes for actions occurring in a sequence is to use a tree diagram. From this, you can see the sample space has 12 outcomes.
Tree Diagram for Coin and Die Experiment • {H1, H2, H3, H4, H5, H6, T1, T2, T3, T4, T5, T6} • | T H 1 2 3 4 5 6 1 2 3 4 5 6 H1 H2 H3 H4 H5 H6 T1 T2 T3 T4 T5 T6 1
Some more • A probability experiment consists of recording a response to the survey statement below and tossing a coin. Identify the sample space. • Survey: There should be a limit to the number of terms a US senator can serve. • Agree Disagree No opinion
Some more • A probability experiment consists of recording a response to the survey statement below and tossing a coin. Identify the sample space. • A. Start a tree diagram by forming a branch for each possible response to the survey. Agree Disagree No opinion
Some more • A probability experiment consists of recording a response to the survey statement below and tossing a coin. Identify the sample space. • B. At the end of each survey response branch, draw a new branch for each possible coin outcome. Agree Disagree No opinion H T H T H T
Some more • A probability experiment consists of recording a response to the survey statement below and tossing a coin. Identify the sample space. • C. Find the number of outcomes in the sample space. In this case -- 6 Agree Disagree No opinion H T H T H T
Some more • A probability experiment consists of recording a response to the survey statement below and tossing a coin. Identify the sample space. • D. List the sample space • {Ah, At, Dh, Dt, Nh, Nt} Agree Disagree No opinion H T H T H T
Simple events • Simple Event: An event that consists of a single outcome. • Decide whether the event is simple or not. Explain your reasoning: • 1. For quality control, you randomly select a computer chip from a batch that has been manufactured that day. Event A is selecting a specific defective chip. (Simple because it has only one outcome: choosing a specific defective chip. So, the event is a simple event. • 2. You roll a six-sided die. Even B is rolling at least a 4. • B has 3 outcomes: rolling a 4, 5 or 6. Because the event has more than one outcome, it is not simple.
Simple events • You ask for a student’s age at his or her last birthday. Decide whether each even is simple or not: • 1. Event C: The student’s age is between 18 and 23, inclusive. • A. Decide how many outcomes are in the event. • B. State whether the event is simple or not.
Simple events • You ask for a student’s age at his or her last birthday. Decide whether each even is simple or not: • 1. Event C: The student’s age is between 18 and 23, inclusive. • A. Decide how many outcomes are in the event. The student’s age can be {18, 19, 20, 21, 22, or 23} = 6 outcomes • B. State whether the event is simple or not. Because there are 6 outcomes, it is not a simple event.
Simple events • You ask for a student’s age at his or her last birthday. Decide whether each even is simple or not: • 1. Event D: The student’s age is 20. • A. Decide how many outcomes are in the event. • B. State whether the event is simple or not.
Simple events • You ask for a student’s age at his or her last birthday. Decide whether each even is simple or not: • 1. Event D: The student’s age is 20. • A. Decide how many outcomes are in the event. There is only 1 outcome – the student is 20. • B. State whether the event is simple or not. Since there is only one outcome, it is a simple event.
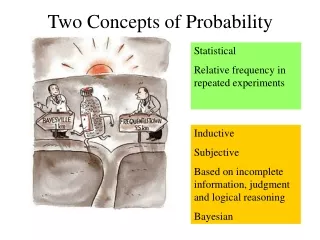
Types of probability • Three types of probability: • 1. Classical probability • 2. empirical probability • 3. subjective probability
Classical probability • P(E) = # of outcomes in E___________ • Total # of outcomes in sample space • You roll a six-sided die. Find the probability of the following: • 1. Event A: rolling a 3 • 2. Event B: rolling a 7 • 3. Event C: rolling a number less than 5.
Classical probability • P(E) = # of outcomes in E___________ • Total # of outcomes in sample space • You roll a six-sided die. Find the probability of the following: • First when rolling a six-sided die, the sample space consists of six outcomes {1, 2, 3, 4, 5, 6}
Classical probability • P(E) = # of outcomes in E___________ • Total # of outcomes in sample space • You roll a six-sided die. Find the probability of the following: • 1. Event A: rolling a 3 There is one outcome in event A = {3}. So, • P(3) = 1/6 = 0.167
Classical probability • P(E) = # of outcomes in E___________ • Total # of outcomes in sample space • You roll a six-sided die. Find the probability of the following: • 2. Event B: rolling a 7 Because 7 is not in the sample space, there are no outcomes in event B. So, • P(7) = 0/6 = 0
Classical probability • P(E) = # of outcomes in E___________ • Total # of outcomes in sample space • You roll a six-sided die. Find the probability of the following: • 3. Event C: rolling a number less than 5. There are four outcomes in event C {1, 2, 3, 4}. So • P(number less than 5) = 4/6 = 2/3 ≈0.667
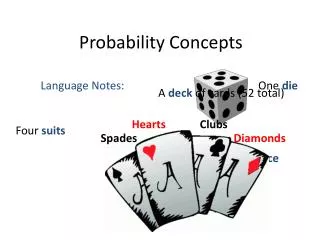
Example • You select a card from a standard deck. Find the probability of the following: • 1. Event D: Selecting a seven of diamonds. • 2. Event E: Selecting a diamond • 3. Event F: Selecting a diamond, heart, club or spade. • A. Identify the total number of outcomes in the sample space. • B. Find the number of outcomes in the event. • C. Use the classical probability formula.
Example • You select a card from a standard deck. Find the probability of the following: • 1. Event D: Selecting a seven of diamonds. • A. Identify the total number of outcomes in the sample space. (52) • B. Find the number of outcomes in the event. (1) • C. Use the classical probability formula. • P(52) = 1/52 or 0.0192
Example • You select a card from a standard deck. Find the probability of the following: • 2. Event E: Selecting a diamond • A. Identify the total number of outcomes in the sample space. (52) • B. Find the number of outcomes in the event. (13) • C. Use the classical probability formula. • P(52) = 13/52 or 0.25 P(52) = 1/52 or 0.0192
Example • You select a card from a standard deck. Find the probability of the following: • 3. Event F: Selecting a diamond, heart, club or spade. • A. Identify the total number of outcomes in the sample space. (52) • B. Find the number of outcomes in the event. (52) • C. Use the classical probability formula. • P(52) = 52/52 or 1.0
Empirical Probability • Based on observation obtained from probability experiments. The empirical probability of an event E is the relative frequency of event E
Example • A pond containing 3 types of fish: bluegills, redgills, and crappies. Each fish in the pond is equally likely to be caught. You catch 40 fish and record the type. Each time, you release the fish back in to the pond. The following frequency distribution shows your results. If you catch another fish, what is the probability that it is a bluegill?
Empirical Probability ex. continued • The event is “catching a bluegill.” In your experiment, the frequency of this event is 13. because the total of the frequencies is 40, the empirical probability of catching a bluegill is: • P(bluegill) = 13/40 or 0.325
Example • An insurance company determines that in every 100 claims, 4 are fraudulent. What is the probability that the next claim the company processes is fraudulent. • A. Identify the event. Find the frequency of the event. (finding the fraudulent claims, 4) • B. Find the total frequency for the experiment. (100) • C. Find the relative frequency of the event. • P(fraudulent claim) = 4/100 or .04
Law of large numbers • As you increase the number of times a probability experiment is repeated, the empirical probability (relative frequency) of an event approaches the theoretical probability of the event. This is known as the law of large numbers.
Using frequency distributions to find Probability • You survey a sample of 1000 employees at a company and record the ages of each. The results are shown below. If you randomly select another employee, what is the probability that the employee is between 25 and 34 years old?
Using frequency distributions to find Probability • P(age 25-34) = 366/1000 = 0.366
Example • Find the probability that an employee chosen at random is between 15 and 24 years old. • P(age 15-24) = 54/1000 = .054
Subjective Probability • Subjective probability result from intuition, educated guesses, and estimates. For instance, given a patient’s health and extent of injuries, a doctor may feel a patient has 90% chance of a full recovery. A business analyst may predict that the chance of the employees of a certain company going on strike is .25 • A probability cannot be negative or greater than 1, So, the probability of and event E is between 0 and 1, inclusive. That is 0 P(E) 1
Classifying types of Probability • Classify each statement as an example of classical probability, empirical probability or subjective probability. Explain your reasoning. • 1. The probability of your phone ringing during the dinner hour is 0.5 • This probability is most likely based on an educated guess. It is an example of subjective probability.
Classifying types of Probability • Classify each statement as an example of classical probability, empirical probability or subjective probability. Explain your reasoning. • 2. The probability that a voter chosen at random will vote Republican is 0.45. • This statement is most likely based on a survey of voters, so it is an example of empirical probability.
Classifying types of Probability • Classify each statement as an example of classical probability, empirical probability or subjective probability. Explain your reasoning. • 3. The probability of winning a 1000-ticket raffle with one ticket is 1/1000. • Because you know the number of outcomes and each is equally likely, this is an example of classical probability.
Classifying types of Probability • Classify each statement as an example of classical probability, empirical probability or subjective probability. Explain your reasoning. • Based on previous counts, the probability of a salmon successfully passing through a dam on the Columbia River is 0.85. • Event: = salmon successfully passing through a dam on the Columbia River. • Experimentation, Empirical probability.
Properties of Probability • The sum of the probabilities of all outcomes in a sample space is 1 or 100%. An important result of this fact is that if you know the probability of event E, you can find the probability of the complement of event E. • The complement of Event E, is the set of all outcomes in a sample space that are not included in event E. The complement of event E is denoted by E’ and is read as “E prime.”
Example • For instance, you roll a die and let E be the event “the number is at least 5,” then the complement of E is the event “the number is less than 5.” In other words, E = {5, 6} and E’ = {1, 2, 3, 4} • Using the definition of the complement of an event and the fact that the sum of the probabilities of all outcomes is 1, you can determine the following formulas: • P(E) + P(E’) = 1 • P(E) = 1 – P(E’) • P(E’) = 1 – P(E)
Finding the probability of the complement of an event • Use the frequency distribution given in example 5 to find the probability of randomly choosing an employee who is not between 25 and 34. • P(age 25-34) = 366/1000 = 0.366 • So the probability that an employee is not between the ages of 25-34 is • P(age is not 25-34) = 1 – 366/1000 = 634/1000 = 0.634
Example: Use the frequency distribution in Example 4 to find the probability that a fish that is caught is NOT a redgill. • A. Find the probability that the fish is a redgill. • 17/40 = .425 • B. Subtract the resulting probability from 1— • 1-.425 = .575 • C. State the probability as a fraction and a decimal. • 23/40 = .575