Download
1 / 19
190 likes | 252 Vues
Explore the distinction between statistical and inductive probability concepts through methods like Bayesian analysis, quantile plots, and box plots. Learn about the Po River's minimum annual flow data analysis with various visualization techniques. Gain insights into numerical quantities, skewness, causality, and distribution comparisons.

E N D
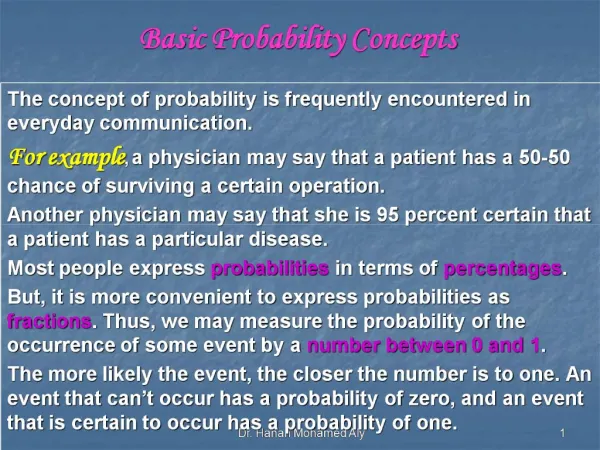
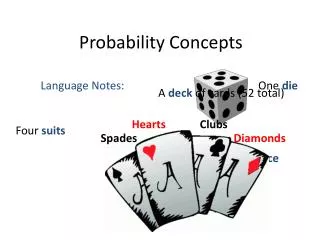
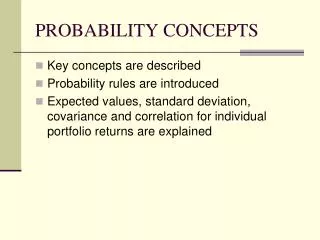
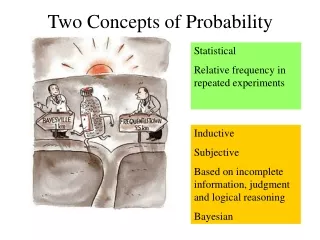
Two Concepts of Probability Statistical Relative frequency in repeated experiments Inductive Subjective Based on incomplete information, judgment and logical reasoning Bayesian
Line Diagram From Kottegoda and Rosso, 1997 p3
Dot diagram From Kottegoda and Rosso, 1997 p4
Histogram of minimum annual flow in the Po river between 1918 and 1978
Minimum annual flow in the Po river between 1918 and 1978 Alternative histogram axis scaling - Relative Frequency - Density
Po River, Minimum annual flow cumulative relative frequency(number of values ≤ n)/n (KR p 8) qs=sort(q) n=length(q) crf=(0:(n-1))/n plot(qs,crf)
Po River, Minimum annual flow Quantile plot (Q-plot) qs=sort(q) n=length(q) crf=(0:(n-1))/n plot(crf,qs) 75% Quantile or quartile Median Interquartile range IQR 25% Quantile or quartile
pi qi Quantile Definition p x A quantile qi is the random variable value associated with a specific cumulative probability pi
Time Series Box Plot Median Box (Red Lines) enclose 50% of the values
Box Plot Outliers: beyond 1.5*IQR Whiskers: 1.5*IQR or largest value Box: 25th %tile to 75th %tile Line: Median (50th %tile) - not the mean Note: The range shown by the box is called the “Inter-Quartile Range” or IQR. This is a robust measure of spread. It is insensitive to outliers since it is based purely on the rank of the values.
Outliers Horizontal Line is the mean Compare change in mean and median between Aug-Sep. Note Skew in September Seasonality of Flow “Monthly Subseries Plot” - time series for each month Flow (cfs) Box Plots Flow (cfs)
Flow = f(Pumping) Causality? Co-effect? OR Pumping = f(Flow) Water Level = f(Pumping) Logical relationship Multiple Scatterplots
Scatterplot - between raw x and y data Q-Q plot - between sorted x and y data Compares individual X and Y values Compares the distributions of X and Y
pi qi Quantiles to compare to theoretical distribution Rank the data Theoretical distribution, e.g. Standard Normal x1 x2 x3 . . . xn qi is the distribution specific theoretical quantile associated with ranked data value xi
QQ-plot for Log-Transformed Flows ln(xi) QQ-plot for Raw Flows qi Quantile-Quantile Plots xi qi Used as a basis for finding transformation to make the Raw flows Normally distributed.
Quantile plots and Probability Plots Probability Plot Q-Q Plot Theoretical quantile axis is relabeled with corresponding probability values