Probability concepts
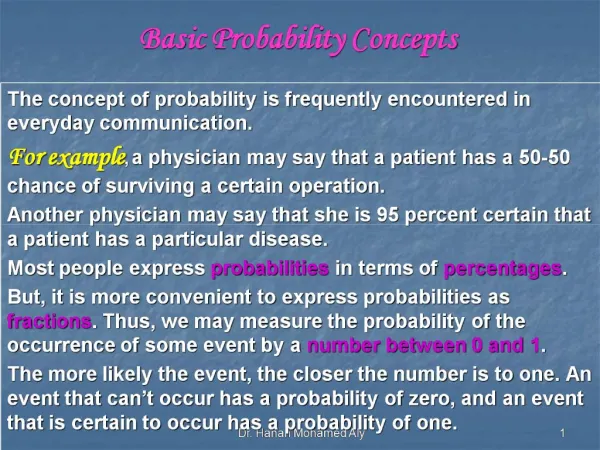
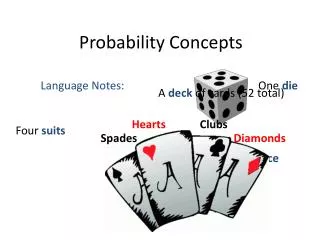
Probability concepts. Introduction. Fundamental Concepts. A variable is random if its outcome is uncertain, where an outcome is an observable future value of the variable. An event is the specified set of possible outcomes of a random variable.


Probability concepts
E N D
Presentation Transcript
Introduction Fundamental Concepts A variable is random if its outcome is uncertain, where an outcome is an observable future value of the variable. An event is the specified set of possible outcomes of a random variable. Events are mutually exclusive when the possible future outcomes can only occur one at a time and exhaustive when the set of outcomes includes every possible value the variable could take in the future. Example: The future size of a dividend can be stated as a mutually exclusive and exhaustive event wherein dividends increase, decrease, or remain unchanged. When the occurrence of one event does not affect the probability of the occurrence of another event, we say the events are independent. Events that are not independent are dependent.
Probability Probability is the fundamental building block of statistics. Probability is a number between 0 and 1 that describes the chance that a stated event from the set of possible outcomes will occur. A probability distribution is the set of probabilities and their associated outcomes that describes all possible outcomes and their associated probabilities. We typically use P(E) to denote the probability of event E. Properties of probability All probabilities must lie between 0 and 1: For n mutually exclusive and exhaustive events, the sum of all probabilities must equal 1:
Types of probability Sources of probabilities In practice, we observe a number of different types of probability. A subjective probability is a personal assessment of the likelihood of an event or set of events occurring in the future and is so named because it relies on the subjective judgment of the person making the assessment. An empirical probability is one that is estimated from observed data, typically using the relative frequency at which an event or set of events has occurred in the past. An a priori probability is one whose values are obtained from mathematical or logical analysis.
Probability as odds Probabilities are often stated as odds for or against a given event occurring. Tire industry analysts are interested in the odds of a removal of import restrictions on Chinese tires. Your analyst has assessed the probability of removal as 60%. What are the odds for and against removal? Odds for: Odds against: Odds for: Odds against:
Mutually Inconsistent Probabilities The Dutch Book Theorem describes how to profit from inconsistent probabilities. Stock prices and other forward-looking financial variables often contain probabilities that we cannot observe directly. We can often infer something about the probability of an event(s) that will affect more than one firm from information about the set of firms that will be affected. When this process reveals inferred probabilities for two or more firms that are different and, therefore, inconsistent, there may be a possibility for profitable investment strategies.
Mutually Inconsistent probabilities Focus on: Profiting from Inconsistent Probabilities Cleveland Corp. and High Noon Inc. are both U.S. tire makers and are fundamentally similar. The sales of both companies stand to be harmed substantially from the removal of import restrictions on inexpensive imported tires. The price of Cleveland Corp. shares reflects a probability of 0.60 that the restrictions will be removed within the year. The price of High Noon Inc. stock, however, reflects a 0.70 probability that the restrictions will be removed within that time frame. By all other information related to valuation, the two stocks appear comparably valued. How would you characterize the implied probabilities reflected in share prices? Which stock is relatively overvalued compared with the other?
Mutually Inconsistent probabilities Focus on: Profiting from Inconsistent Probabilities The implied probabilities would be characterized as inconsistent probabilities: Cleveland Corp. is more overvalued because its price includes a lower probability of an unfavorable event.
Conditional and unconditional probability When we observe the probability that an event (A) occurs without taking into account whether it is necessarily preceded by any other specific events, it is known as an unconditional probability. Also known as a marginal probability. Notation: When we observe the probability of a given event after taking into account that another event has already occurred (A occurs given that B has occurred), it is known as a conditional probability. Notation: Language: the probability of A given B
Joint Probability When two events occur, the combined probability of their occurrence is known as the joint probability. Notation: Language: the probability of A and B The calculation of a joint probability is governed by a set of probability rules, as are the calculations of the probability of other combinations of events. P(AB) P(B) P(A)
Working with probabilities We use the multiplication rule to assess the joint probability of A and B occurring. Note that from this equation, we can calculate the conditional probability of A given B, as long as the probability of B isn’t zero. We use the addition rule to assess the probability that A or Bor both occur:
Multiplication rule Focus on: Calculations Recall that our probability of relaxed trade restrictions has been estimated at 60%. If the probability of reduced sales, given that the trade restrictions are relaxed, is 80%, then the probability of relaxed trade restrictions and reduced sales is
Addition rule Focus on: Calculations If the probability of relaxed import restrictions is 0.60 and the probability of a trade war is 0.10, then the probability of relaxed trade restrictions or a trade war is 0.65 when the joint probability of a trade war and relaxed trade restrictions is 0.05. P(AB) = 0.05 P(B) = 0.1 P(A) = 0.6
Dependent and Independent events When events are independent, the occurrence of one does not affect the probability of the other. In other words, P(A|B = 0) and P(B|A) = 0. To determine the joint probability, we use the multiplication rule: or, more generally, P(A) P(B) P(C)
Joint probability of independent events Focus on: Calculations Recall our analyst’s estimated probability of relaxed import restrictions (60%). If Ais the probability of a heavy winter snowfall (40%) and B is the independent probability of relaxed restrictions: Then the joint probability of relaxed import restrictions and a heavy winter snowfall is:
Total probability rule Focus on: Calculations Recall that we have a 60% (40%) chance of trade restrictions being relaxed (maintained). P(RR) = 0.6, where RR is relaxed restrictions. P(NR) = 0.4, where NR is no relaxation. Our analysts believe that the stock price will decrease if trade restrictions are relaxed with a probability of 30% and that they will decrease if trade restrictions are not relaxed with a probability of 15%. P(DS|RR) = 0.30 P(DS|NR) = 0.15 What is the probability of a decrease in stock prices?
Expected value Random Variable The expected value of a random variable is the probability-weighted average of the possible outcomes for that variable. We anticipate that there is a 15% chance that next year’s return on holding Cleveland Corp will be 4%, a 60% chance it will be 6%, and a 25% chance it will be 8%. What is the expected return on Cleveland Corp stock?
Variance Random Variable The variance of a random value is the sum of the squared deviations from the expected value weighted by their associated probabilities. This value is a measure of the dispersion of possible values. Because it has units that are squared, it is not easy to interpret. Accordingly, we use its positive square root, standard deviation, more often because it also measures dispersion but has the same units as expected value. The standard deviation of returns for Cleveland Corp. is then:
Conditional Expectations Focus on: Calculations The total probability rule applies to expected values just as it does any mutually exclusive and exhaustive set of possible outcomes across a set of states. This equation allows us to calculate the expected value of a random variable (X) as a function of the probabilities of future possible states, P(S), and the conditional value of the expected value of X in those states, E(X|S).
Conditional Expected value Focus on: Calculations Example: Recall that we have a 60% chance of relaxed trade restrictions and, therefore, a 40% of maintaining them. If we expect the Cleveland Corp. stock to return 6% if trade restrictions are maintained and lose 11% if they are relaxed, what is the expected change in return for Cleveland Corp.?
Tree diagram A visual representation of the future possible outcomes and associated probabilities of a random variable. Recall that we have a 60% (40%) chance of trade restrictions being relaxed (maintained) and a 40% (60%) chance of a heavy (light) winter snowfall. Our analyst projects that if trade restrictions are relaxed and there is a light snowfall, Cleveland Corp. will have a stock return of 15%, but if restrictions are relaxed and there is a heavy snowfall, there will be a stock return of 5%. If trade restrictions are not relaxed and there is a light snowfall, we will have a stock return of 2%, but if we have a heavy snowfall, we will have stock return of 12%. How do we represent the possible impact of snowfall and trade restrictions on the return of Cleveland Corp. stock? What is our overall expected stock return on Cleveland Corp.?
Tree diagram Focus on: Calculations Return–5% P(RH) = 0.24 P(Heavy snow) = 0.4 P(Relaxed restrictions) = 0.6 Return –15% P(RL) = 0.36 P(Light snow) = 0.6 E(Return) = –4.2% Return 12% P(MH) = 0.16 P(Heavy snow) = 0.4 P(Maintained restrictions)=0.4 Return 2% P(ML) = 0.24 P(Light snow) = 0.6
Covariance Covariance and correlation are both measures of the extent to which two random variables move together. Covariance is the expected value of the product of each variable’s deviation from its respective mean.
Correlation Covariance and correlation are both measures of the extent to which two random variables move together. Correlation is a scaled transformation of covariance wherein the extent of comovement is measured along a scale from exactly the same movement in the same direction to exactly the same movement in opposite directions. When two variables move the same degree in opposing directions, they are said to be perfectly negatively correlated. When two variables move the same degree in the same direction, they are said to be perfectly positively correlated. When there is absolutely no commonality of movement, the variables are said to be uncorrelated.
Covariance and Correlation Focus On: Calculations We anticipate that there is a 15% chance that next year’s stock returns for Cleveland Corp. will be 4%, a 60% chance they will be 6%, and a 25% chance they will be 8%. The standard deviation of returns is 1.249%, and the expected value is 6.2%. We anticipate that the same probabilities and states are associated with a 2% return for High Noon Inc., a 3% return, and a 3.5% return. The standard deviation of High Noon Inc. returns is then 0.46%, and its expected value is 2.975%. What is the covariance between Cleveland and High Noon returns? What is the correlation between Cleveland and High Noon returns?
Portfolio returns Portfolio expected return, variance, and standard deviation are functions of the weights invested in each asset, much like probabilities function as weights. The expected return to a portfolio is the sum of each of the individual assets expected returns multiplied by its associated weight. The variance of a portfolio’s return is the sum of the squared deviations from the mean multiplied by the associated weights.
Portfolio returns Focus On: Calculations Consider a portfolio equally invested in High Noon and Cleveland Corp. What will be its expected return and standard deviation of returns? Recall that the expected returns are 2.975% and 6.2%, respectively. Likewise, the standard deviations are 0.46% and 1.249%, respectively, and the covariance between the two is 0.0000555.
Covariance using a joint probability function We can use the joint probability function to calculate covariance as a function of the deviations for each variable under each possible future economic state. Your analysts have updated their probability and outcome assessments for Cleveland Corp. and High Noon Inc. as shown in the table below.
Covariance using a joint probability function Covariance = 3.6 + 1.2 + 0.5 + 5.7 = 11
Bayes’ Rule Bayes’ Rule is often used to determine how a subjective belief should change given new evidence. First term: updated probability given new information, also known as posterior probability. Second term: probability of the new information given the event over the probability of the event. Third term: prior probability of the event.
Bayesian updating Focus On: Calculations Suppose you have the following prior probabilities: P(EPS exceeded consensus) = 0.45 P(EPS met consensus) = 0.30 P(EPS fell short of consensus) = 0.25 Given that DriveMed announces an expansion, what is the probability that prior quarter EPS (unreleased) exceeds consensus?
Bayesian updating Focus On: Calculations You believe the conditional probabilities are P(DriveMed expands | EPS exceeded consensus) = 0.75 P(DriveMed expands | EPS met consensus) = 0.20 P(DriveMed expands | EPS fell short of consensus) = 0.05 Use the total probability rule. Apply Bayes’ formula.
Bayesian updating Focus On: Calculations Recall that you updated the probability that last quarter EPS exceeded the consensus from .45 to .823 after the expansion announcement.
Bayesian updating Focus On: Calculations Update the prior probability that DriveMed’s EPS met consensus. Result is 0.146341, up from 0.3. Update the prior probability that DriveMed’s EPS fell short of consensus. Result is 0.030488, down from 0.25. Show that the three updated probabilities sum to 1. Result: 0.030488 + 0.146341 + 0.823171 = 1
Counting Problems The foundation for many probability statements lies in enumerating the possible outcomes in order to assess the likelihood of their occurrence. If a task can be done in n1 ways, a second task can be done in n2 ways, a third task in n3 ways, and so on, we can enumerate the number of ways in which the tasks can be done by taking the product of all the ways all of the tasks can be done. If there are k tasks, this mean the number of ways the tasks can be done is You have asked your analyst to perform four different analyses on the firm he covers. The first process covers six steps; the second, four; the third, three; and the last, seven. How many possible ways can the analyst perform the steps? (6)(4)(7)(3) = 504
Factorial The mathematical factorial function is used to enumerate the number of ways in which every member of a group can be assigned a single slot when the number of slots equals the number of members in the group. In short, once the first ranking is made, there are n – 1 firms left to be ranked; after the second, n – 2; and so on, until all firms are ranked. The symbol “!” is used to denote the factorial operation. Your firm covers seven firms, and you have asked your analyst to rank the seven firms. How many different possible combinations of rankings are possible for the seven firms? n! = (7)(6)(5)(4)(3)(2)(1) = 5,040
Combinatorial The mathematical process by which every member of a group can be assigned to one of two slots when there are only two categories is called a “combinatorial process.” The formula for this calculation is called the “binomial formula” or “combination formula.” It is often described as the way we can choose r objects from n objects when the order of the r objects does not matter. You have asked the analyst to rate each of the 10 firms he covers as a “watchlist” or “not-watchlist” firm but indicated there can only be 4 watchlist firms. How many possible combinations are there of the resulting groupings? The notation in parenthesis at the beginning of the expression is read as “n choose r.”
Permutations The mathematical process by which every member of a group can be assigned to a set of slots when the order of the slots does matter is known as a permutation. You have asked the analyst to select and rank four of the six firms he left off the watchlist. How many possible combinations of rankings are there of the top four non-watchlist firms?
Counting Problems You are assigned the task of selecting 6 “interesting” firms from a set of 24 firms your boss has screened. How many different potential sets of six firms can you select? Your boss has changed the task, asking you to rank order the 6 most interesting firms out of the 24 selected. How many different possible rankings can you select?
How Do We Choose Which Counting Method to Use? • Does the task that I want to measure have a finite number of possible outcomes? If the answer is yes, you may be able to use a tool in this section, and you can go to the second question. If the answer is no, the number of outcomes is infinite, and the tools in this section do not apply. • Do I want to assign every member of a group of size n to one of n slots (or tasks)? If the answer is yes, use n factorial. If the answer is no, go to the third question. • Do I want to count the number of ways to apply one of three or more labels to each member of a group? If the answer is yes, use the multinomial formula. If the answer is no, go to the fourth question. • Do I want to count the number of ways that I can choose r objects from a total of n, when the order in which I list the r objects does not matter (can I give the r objects a label)? If the answer to these questions is yes, the combination formula applies. If the answer is no, go to the fifth question. • Do I want to count the number of ways I can choose r objects from a total of n, when the order in which I list the r objects is important? If the answer is yes, the permutation formula applies. If the answer is no, go to question 6. • Can the multiplication rule of counting be used? If it cannot, you may have to count the possibilities one by one, or use more advanced techniques than those presented here.
summary The concepts of probability and random variables lie at the center of inferential and descriptive statistics, and thus form an important basis for the chapters to come. In the descriptive statistics area, measures of expected return, variance, and covariance play a central role in portfolio applications in investments. We can use a variety of probability tools and rules to determine the likelihood of a given event or set of events in the future. We can use counting rules to determine the probability of a given event or set of events in combination by enumerating the possible potential outcomes.