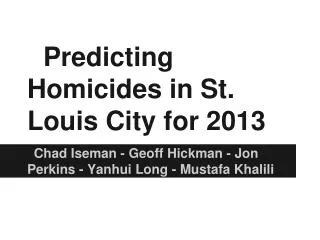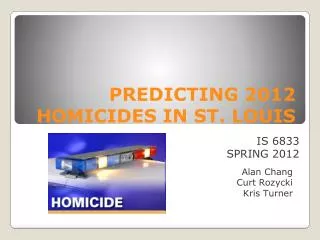
PREDICTING 2012 HOMICIDES IN ST. LOUIS
150 likes | 329 Vues
PREDICTING 2012 HOMICIDES IN ST. LOUIS. Alan Chang Curt Rozycki Kris Turner. IS 6833 SPRING 2012. Introduction. According to FBI crime reporting data, St. Louis was considered to be the most dangerous city in the United States in 2011.

PREDICTING 2012 HOMICIDES IN ST. LOUIS
E N D
Presentation Transcript
PREDICTING 2012 HOMICIDES IN ST. LOUIS Alan Chang Curt Rozycki Kris Turner IS 6833 SPRING 2012
Introduction According to FBI crime reporting data, St. Louis was considered to be the most dangerous city in the United States in 2011. An Index Score of 100 is equal to the national crime rate. This means that St. Louis had a crime rate of more than five times the national average.
Analysis Approach Flow Chart Analysis Regression Model (Individual) Collect geographic data Determine which models for 2011 Determine Individual Variable Project Start Run Multiple Regression Analysis the X and Y variable Linear Regression model for 2012 Predict the number of 2012 Project Close
2011 St. Louis City Homicide Cases Basic Data
Variable List • Population • Murder/capita • Race (White/Africa American/Asian) • Median Household Income • Education Level (Complete High School Degree) • Married • Male/Female Ratio • Have Children (under 18yrs) • Median Home Value
Regression Models Total 16 different Models
Model Comparison (Regression Analysis) 16 Models Regression Analysis
Best Model (Africa American + Murder/capita + Median Household Income + Education)
Estimate 79 different neighborhoods Analysis 79 neighborhoods 2012 Total 194 Homicides Result of the 2012
Predictions by Neighborhood Red -=> 5 Yellow -2~4 Green -<2 • Top dangerous neighborhoods • Fairground • Baden • Jeff Vanderlou • Dutchtown
How to improve the prediction • More updated yearly data by neighborhood • More variables need provide (guns holders/drug users/genders) • Other modeling method
Conclusion The model presented can be used to provide information to decision makers, such as social worker, polices, and people who want buy a new house.
Reference • http://www.usnews.com/news/articles/2011/02/16/the-11-most-dangerous-cities • St. Louis City Guide (Education level/Household income..) • http://www.areavibes.com/st.+louis-mo/neighborhoods/academy/areavibe/ • St. Louis City Homicides data • http://www.slmpd.org/images/2011_Homicide_Data_For_Website.pdf • 2010 Census Data • http://factfinder2.census.gov/faces/nav/jsf/pages/searchresults.xhtml?refresh=t#none • St. Louis Crime Report • http://www.stltoday.com/news/local/stl-info/st-louis-crime-reports/html_84061828-6373-11df- • a1f4-0017a4a78c22.html?appSession=100825937889208