Semiconductors and Photovoltaics
780 likes | 1.01k Vues
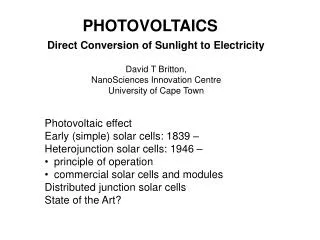
Semiconductors and Photovoltaics. S*/S +. *. -0.5 V. e -. cb. photo-=light, Volta = voltage. e -. 0 V. h ν. I 3 -/I -. 0.5 V. 1.0 V. S/S +. vb. anode. cathode. Neal M. Abrams nmabrams@esf.edu. Three Questions about Solar Electricity. How much solar electricity could we make?

Semiconductors and Photovoltaics
E N D
Presentation Transcript
Semiconductors and Photovoltaics S*/S+ * -0.5 V e- cb photo-=light, Volta = voltage e- 0 V hν I3-/I- 0.5 V 1.0 V S/S+ vb anode cathode Neal M. Abrams nmabrams@esf.edu
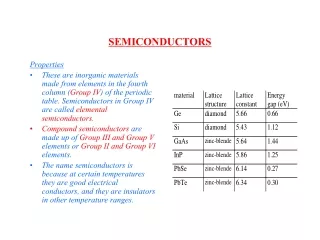
Three Questions about Solar Electricity • How much solar electricity could we make? • How do solar cells work? • What materials are cells made of?
Looking Towards Nature “Trying to do what Mother Nature has been doing for thousands of years…only better” - Dr. Raymond Orbach Source:Berkeley U Can we do this? How?
A (short) historical perspective • Photoelectric effect discovered in 1839 by Bequerel • All metals produce a voltage when subjected to light of the correct wavelength (energy) • Schokley reports the basis of p-n junctions, 1950 • Not pursued until 1954 by Bell Labs • Very expensive, 6% efficiency • Reemerged in late 70’s-early 80’s with gas crisis and history repeats itself… • NASA launches 1 kW array, 1966 • Science drives society and vice-versa
How Much Electricity Do We Make Today? • 1.8x10¹²Watts (continuously) • 6x10⁹persons • 300 Watts/person • 3 100W light bulbs per person • U.S. – 25% of total • 1,500 Watts/person • 15 100W light bulbs per person • 36 kWhr/day/person http://antwrp.gsfc.nasa.gov/apod/ap030426.html . http://www.eia.doe.gov/oiaf/ieo/electricity.html
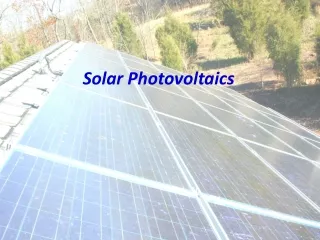
The Solar Dream: There’s lots of sun energy! 1000 W/m2 at High Noon Area required for all US electricity assuming ~10% efficiency, ~100 x 100 miles • 40,000 EJ of solar energy hits the US each year….more than 400x the total energy consumed per year.
Total energy reserves Uncle Harold says: “It is so darned hot here. We just need some of them solar panels!What is the problem?” Aunt Susie says: “Golly it is windy downtown. They just need to install some of those windmills” My dad says: “Boy, you need to figure out how I can fill my car up the garden hose” What is the problem??
Average Irradiance • 30 Year Average of “full sun” per year: • Meaning: Syracuse gets 65% of the sun Phoenix gets and therefore needs more PV modules to get the same number of kWh
The Nature of Light wavelength, energy
Solar Irradiance uv vis IR Energy
Wavelength distribution • 48% of the extraterrestrial irradiance intensity is in the visible range of 380–780 nm • Ultraviolet irradiance (< 380 nm) accounts for 6% of the total intensity • 45% is given off in the upper infrared. • Above 3000 nm the irradiance is energy-negligible.
Power Distribution • Total ultraviolet irradiance below 380 nm is about 92.6 W/m2 • The visible area has a total power of 660 W/m2 • The remaining IR has a total irradiance of 1367 W/m2 Where should we be looking?
Where the Energy Goes • Ozone absorbs solar irradiance almost completely under λ = 290 nm and more weakly to around 700 nm. • Water vapor absorbs in the infrared, with pronounced absorption bands at 1.0, 1.4 and 1.8 μm. • Above 2.5 μm almost the entire irradiance is absorbed by CO2 and H2O. • Some reflection and scattering
Shuttling Electrons http://www.jimhillmedia.com/mb/images/upload/Van-de-Graaf-Generator-web.jpg
i Making Electricity from Light: The Photoelectric Effect Light in (frequency ν) Cathode Anode Electrons out Vacuum tube
Vacuum EnergyGap Electron Energy BluePhoton RedPhoton Electrons in the Cathode Einstein’s Explanation of the Photoelectric Effect Ephoton = hνh – Max Planck’s constant
The Science • Solar energy comes in the form of photons • The photovoltaic effect: E = energy h = Planck’s constant = 6.634 x 10⁻³⁴ Js c = speed of light = 3 x 10⁸m/s λ = wavelength of light • Likewise, E = mc2→energy, mass, and wavelength are related • Atoms are composed of…
Bands E∞ Ionization boundary • Energy states transition from discrete to “smeared” progressing from atom molecule solid • Electrons fill from the bottom up • Highest filled band is the “valence” band • Lowest filled is the “conduction” band E3 E2 E1 atom Diatomic atom Triatomic atom n atoms
Conduction • Materials can be separated as insulators, semiconductors, or conductors • Based on size of VB-CB transition (bandgap) CB CB Forbidden band Eg* ≈ 0 eV Forbidden band Eg* > 5.0 eV Eg* < 5.0 eV CB VB VB VB http://upload.wikimedia.org/wikipedia/commons/3/3f/BandGap-Comparison-withfermi-E.PNG 1 eV = 1240 nm = 1.6 x 10⁻¹⁹ J
i Solar cells: Photons in, Electrons out silicon wafers - + - + Electrons out Photonsin + - + + - - - + SiliconCrystal - +
Solar Cells: Photoelectric Effect in a Semiconductor free electron Conduction Band BandGap GreenPhoton Cell Voltage Electron Energy InfraredPhoton = Valence Band free hole
Mechanism of Electron Generationa Goldilocks problem • Photons with an energy >Eg collide with the material • Energy is conserved and electrons are excited from the VB to the CB • CB electrons travel through a circuit, powering a device Conduction Band - - - - - - - - - - - - - - Eg too small Eg too large Eg just right Valence Band
How do we get the right bandgap? Doping • Increases conductivity (lowers VB-CB threshold) by adding electrons or holes • Adding electrons: n-type (negative); P, As, Sb • Adding holes: p-type (positive); B, Al
The p-n junction n region p region Space charge region + + + + + + + + + + + - - - - - - - - - - - - • Electrons diffuse to border of p-type region • Holes diffuse to border of n-type region
Solar Cell Processes • Charge separation • Reflection • Transmission Reflection - + n-region Recombination - Charge separation + Transmission p-region
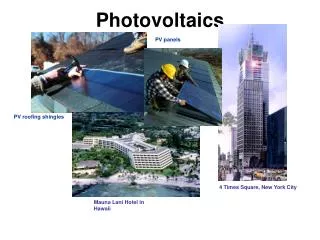
The Magic in the Panel • Photons in sunlight hit the solar panel and are absorbed creating a dc source (a battery) • An array of solar panels converts solar energy into usable DC electricity. Inverters convert the DC to 60 Hz AC to feed the grid. Cover glass anti-reflective coating e- front contact n-layer p-layer back contact
Anatomy of PV cell Cover glass anti-reflective coating e- front contact n-layer p-layer back contact
Photovoltaic types and benefits • Silicon • Single crystal silicon (c-Si) • Multicrystalline silicon (mc-Si) • Amorphous silicon (a-Si) • Thin-film • Silicon • Cadmium telluride, CdTe • Copper indium gallium diselenide , CIGS • Very efficient in diffuse light conditions • Dye-sensitized
Efficiency: How high? Maximum measured efficiencies under lab conditions as of 2008
Limits to Ideal Solar Cell Efficiencies William Shockley • Assumed that recombination is “radiative”
Limits to Solar Cell Efficiency • Recall: • 37% of sunlight is in the visible, 400-700 nm • 32 % of sunlight is in the low-IR, 700-1200 nm • Silicon does not convert photons to electrons above ~1200 • Most of the energy above the bandgap (low wavelengths) is converted to heat
Single Crystal Silicon • First commercial solar cell • High efficiency (Theoretical 27 %) • Practical ~10-15 % • Expensive to produce • Cleanroom environment, ultrahigh purity required = 1.12 eV = 1100 nm Max efficiency = 27 %
Silicon – what PV is made of (for now) • Silicon is the dominant materials in PV production • 26% of the Earth’s crust, second most abundant element by weight (oxygen is #1) • Melting point: 1410 C • Production of pure PV-grade silicon • not easy!
Polycrystalline Silicon • Lower cost • Lower efficiency • Grain boundaries cause electron-hole recombination • Easier to produce • Also amenable to thin film or multicrystalline cells - + Grain boundary
Czochralski method for obtaining single crystal silicon from polycrystalline • Goal: Turn high-purity polycrystalline into high-purity single-crystal • Small single-crystal seed is produced • Used to grow remaining single crystal silicon http://en.wikipedia.org/wiki/File:Czochralski_Process.svg
Thin-film/heterojunctions • Direct-bandgap semiconductors (silicon is indirect) • Very thin layers of high-efficiency PV material • Silicon cells need to be 87.5x thicker to absorb same amount of light • Lower manufacturing costs, less purity • Multiple bandgaps possible (solar lasagna) • Issues with junctions between layers (grain boundaries, current limiting) • Examples: GaInAs, CuInGaSe2(CIGS), CdTe • Materials tend to be toxic (or just not good)
Dye cells • Use molecular dyes as light absorber • Inject electrons into a semiconductor • Inexpensive, flexible materials • Relatively low efficiency (8-12 %) Ruthenium 535-bisTBA (N719) N719 AM1.5
I3- dye*/ dye+ I- dye Dye Cells Dye S*/S+ * e- cb -0.5 V e- hν 0 V e- I3-/I- 0.5 V 1.0 V S/S+ Pt counter vb 13nm TiO2 particles (13 nm) cathode anode transparent conductive oxide (TCO) *Kalyanasundaram, K.; Grätzel, M. Coord. Chem. Rev.1998, 77, 347. ~10μm e- e- load e- e-
Maximum Solar Cell Efficiencies National Renewable Energy Lab (NREL)
evaluating PV cells http://www.udel.edu/iec/NREL_IBC_SHJ_IV_Curve.gif
Revisiting bandgaps • Extra energy leaves as heat Conduction Band heat Eg too small Eg just right - - - - - - - - - - - - - - Valence Band
The Heat Problem in Silicon Voc decreases2.3 mV/°C for silicon Voc vs. time for a Si cell at ~7x white light concentration, with wavelength-selective mirrors placed in the beam path. Voc losses are lowest using NIR light - less power is thermalized
Why might this be? • Heat increases level of valence band electrons • Decreases band gap; distance between Ec and Ev is smaller • Lowers cell voltage EC heat Eg EC EV Eg e- e- e- e- e- e- e- e- e- e- e- e- e- e- e- e- EV e- e- e- e- e- e- e- e- e- e- e- e- e- e- e- e- e- e- e- e- e- e- e- e- e- e- e- e- e- e- e- e- e- e- e- e- e- e- e- e- e- e- e- e- e- e- e- e- e- e- e- e- e- e- e- e- e- e- e- e- e- e- e- e- e- e- e- e- e- e- e-
The Heat Problem – a real example • Voc decreases 136.8 mV/°C • Solar arrays typically put out ~40 DCV • Arrays can heat to 65% above ambient • 90 °F day 140 °F panel (60 °C) • Voc at 25 °C = 40 V, now 35.2 V • 12% loss in power (assuming no change in current) • Take home message: Cooling is very important • Passive works well