Download
1 / 17
170 likes | 319 Vues
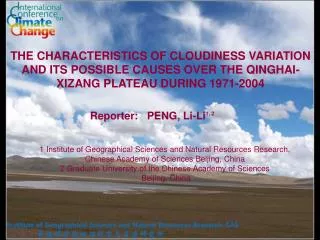
THE CHARACTERISTICS OF CLOUDINESS VARIATION AND ITS POSSIBLE CAUSES OVER THE QINGHAI-XIZANG PLATEAU DURING 1971-2004. Reporter: PENG, Li-Li 1, 2. 1 Institute of Geographical Sciences and Natural Resources Research, Chinese Academy of Sciences Beijing, China

E N D
THE CHARACTERISTICS OF CLOUDINESS VARIATION AND ITS POSSIBLE CAUSES OVER THE QINGHAI-XIZANG PLATEAU DURING 1971-2004 Reporter: PENG, Li-Li1, 2 1 Institute of Geographical Sciences and Natural Resources Research, Chinese Academy of Sciences Beijing, China 2 Graduate University of the Chinese Academy of Sciences Beijing, China
outline Brief introduction: Data and method Result: Discussion: Why research ? Spatial pattern; tendency; correlation Possible causes
1. Brief introduction Cloud is an important climatic factor modulating surface irradiance and hydrological cycle. Its occurrence and properties depend on complex dynamic and thermodynamic couplings between the surface and atmosphere the Qinghai-Xizang Plateaugreatly affects Asian and global climate change because of its unique geographical location.
2. Data and method Fig.1 distribution of station
3. Results 3.1 Spatial Pattern of Total Cloud Amount Fig.2 Distribution of annual average total cloud amount over the Qinghai-Xizang Plateau
3. Results 3.1 Spatial Pattern of Total Cloud Amount Table 1 the ratio of the front 10 eigenvectors with square error obtained from the EOF analysis of standardized data of total cloud amount over the Qinghai-Xizang Plateau The ratio of the front 2 eigenvectors with total square error is 55.6 % and the two eigenvectors are all statistically significant at the 0.05 level.
3. Results 3.1 Spatial Pattern of Total Cloud Amount The first eigenvector shown in figure 2a explains 37.3% of the total variance over the domain. Fig. 3a The second eigenvector shown in figure 2b explains 18.3% of the total variance. Fig. 3b Fig.3 First two leading eigenvectors obtained from the EOF analysis of standardized data of total cloud amount over the Qinghai-Xizang Plateau
3. Results 3.2 The Tendency of Annual and Seasonal Total Cloud Amount Fig.4 Spatial pattern of the linear trend in annual and seasonal total cloud amount in the period 1971-2004
3. Results 3.2 The Tendency of Annual and Seasonal Total Cloud Amount Fig.5 Time series of the standardized departure of total cloud amount over the Qinghai-Xizang Plateau in the period of 1971-2004
3. Results 3.3 Relationship of Total Cloud Amount to Sunshine Duration, Diurnal Temperature Range, Relative Humidity, Precipitation Fig.6 Time series of standardized departure of variables (TC-total cloud amount, S-sunshine duration, DTR-diurnal temperature range)
3. Results 3.3 Relationship of Total Cloud Amount to Sunshine Duration, Diurnal Temperature Range, Relative Humidity, Precipitation summer winter Fig.7 Spatial pattern of the correlative coefficientsbetween total cloud amount and sunshine duration
Results 3 Relationship of Total Cloud Amount to Sunshine Duration, Diurnal Temperature Range, Relative Humidity, Precipitation Fig.8 Time series of standardized departure of TC-total cloud amount and DTR-diurnal temperature range
Results 3 Relationship of Total Cloud Amount to Sunshine Duration, Diurnal Temperature Range, Relative Humidity, Precipitation Fig.9 Time series of standardized departure of variables (TC-total cloud amount, RH-relative humidity, P-precipitation)
Discussion Total Cloud Amount and Atmospheric Aerosols the atmospheric aerosols over the Plateau have increased from 1961 to 1990 (Luo et al., 2000) black carbon observed in the Waliguan atmospheric background monitoring station has distinct increased during 1991-2003 (Zhou et al., 2006). Year Fig.10 concentration of black carbon observed inthe Waliguan atmosphericbackground monitoring station during 1991-2003(zhou et al., 2006)
Discussion Total Cloud Amount and Ozone Fig.11 variation of total ozone column observed inthe Waliguan atmosphericbackground monitoring station during 1991-2006(zhou et al., 2006) Fig.12 variation of cloudiness of stations around WLG station in summer
Conclusion in spite of large climatic difference over the south and the north of the Plateau for topographic factors, the variance of total cloud amount over the Plateau during 1971-2004 is consistent. decreasing trend is observed over the Qinghai-Xizang Plateau. the total cloud amount is negative with sunshine duration and diurnal temperature range, and is positive with precipitation and relative humidity, respectively. Observed increasing atmosphere aerosols over the Plateau are considered vital factor causing the variances of total cloud amount over there.