Download
1 / 24
240 likes | 402 Vues
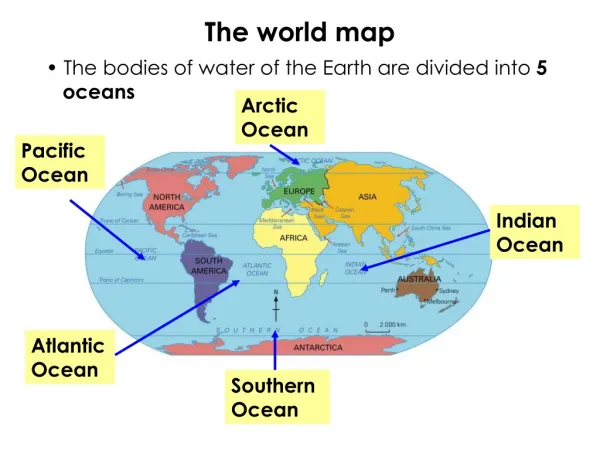
GEOG 441 Watershed Systems Precipitation. Monday 1/26/2009. Precipitation. Characteristics Spatial Temporal Frequency Analysis. Precipitation. Units- Volume (L 3 ) or Depth/Time (L/T) Input in the mass balance Continuous random variable. Spatial Characteristics. Point measurements.

E N D
GEOG 441Watershed SystemsPrecipitation Monday 1/26/2009
Precipitation • Characteristics • Spatial • Temporal • Frequency Analysis
Precipitation • Units- Volume (L3) or Depth/Time (L/T) • Input in the mass balance • Continuous random variable
Spatial Characteristics • Point measurements
Spatial Characteristics • Radar
Spatial Characteristics • Hyetographs
Temporal Characteristics • Intensity • Rate of precip over some period of time • Duration • Frequency
Review • Histograms • Normal distributions • Extreme value distributions • Cumulative Distributions • An example with UNC graduate salaries
Review Normal distributions mean Std dev
Annual Rainfall • Assumes data follows normal distribution • Typically works for annual precipitation data
Exceedance Probabilities • [dimensionless], the relative frequency associated with a random variable attaining a value greater than some specified value. • For example- calculate probability that annual precipitation in any given year will exceed 1.0 m
Exceedance Probability • Normalize data to a z value • Find cumulative probability for a given value (Table A3.2)
Annual Maxima • Takes the highest value for the entire year
Partial Duration • All values above a certain base • Closely related to annual values for long return periods • Could be more (frequent) or less (infrequent) values than annual maxima for a given threshold
Precipitation Frequency Examples from AZ and NC http://hdsc.nws.noaa.gov/hdsc/pfds/index.html
Return Period • What is the probability of a storm of X magnitude this year? • Inverse of exceedance probability Treturn= (n+1)/m n= # of years of observation m= rank
Return Period- Washington, DC Data from Table 2.1 plotted