Download

1 / 5
50 likes | 158 Vues
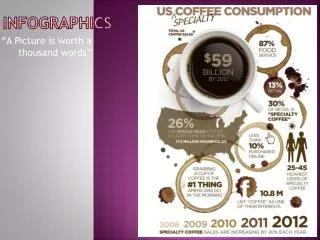
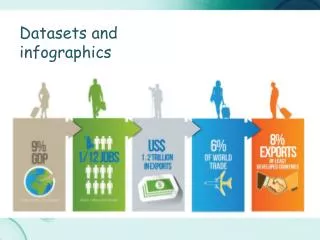
This guide explores the concept of infographics, explaining their purpose and benefits. It provides an interactive approach to learning, starting with an example from htwins.net to illustrate advanced infographics. Participants will analyze static infographic examples from provided links and then search the web for additional instances. By the end of the activity, all learners will have created a basic infographic in Excel, enhanced it in Word for visual appeal, and added annotations and images. Advanced learners may utilize sophisticated chart formatting techniques.

E N D
Objectives • Can I explain what an info-graphic is and why we use them? • Can I use a dataset to create my own info-graphic?
To start • As a group look at this: http://htwins.net/scale2/ • this is an example of a very advanced info-graphic
To start • Here are 2 examples of static info-graphics: http://farm3.static.flickr.com/2541/4187586892_c57cc0f100.jpg http://www.webhostingmasters.com/wp-content/uploads/2012/04/social_media_infographic-02.jpg • Now use the web to find your own examples of info-graphics
Success Criteria All: will have created a basic info-graphic in Excel and will have pasted it into a Word document Most: will have annotated and improved their infographicin Word to make it more visually appealing • Add images • Add labels • Explain what it shows Some: will use advanced chart formatting features in Excel • Will have created more than one chart