Infographics and Education
120 likes | 233 Vues
Explore the world of infographics as visual tools for interpreting and summarizing information. Learn from examples such as Pioneer 10 and 11, Tagul, Wordle, Tagxedo, Chartsbin, Dipity, Creately, Infogr.am, Visual.ly, and more. Discover the importance of knowing your audience, planning, designing, and keeping it simple. Jeff Howson shares top tips for creating engaging infographics for educational purposes.

Infographics and Education
E N D
Presentation Transcript
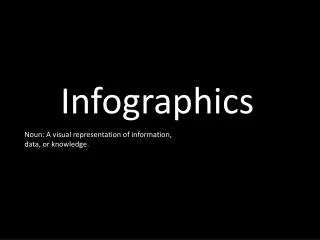
DESIGNED Visual representations of information, data or knowledge Infographicsand Education Jeff Howson jeff@aspiredlearning.co.uk
Illustration Interpretation Illumination Summary
Examples Pioneer 10 and 11
Tagul Wordle Tools(Words) Tagxedo
(Maps) (Timelines) Tools Chartsbin Dipity
Creately Infogr.am Tools(Charts)
Tools(Favourites) Visual.ly Easel.ly
Gapminder More examples
Know the audience Choose / Investigate / Analyse / Organise TOP TIPS Tell a story / Be creative Plan, Plan, Plan / Design it well Be accurate Use the right tool(s) Keep it simple / Share it
Infographicsand Education Jeff Howson jeff@aspiredlearning.co.uk