VisWeek: Graphics and Infographics
330 likes | 358 Vues
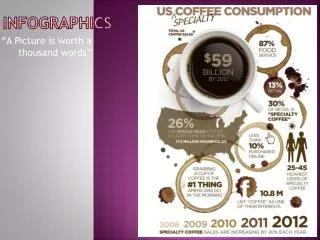
Slides from my recent talk at the Visweek conference in Seattle, WA.

VisWeek: Graphics and Infographics
E N D
Presentation Transcript
Graphics, Infographics, and Data Visualization: An Economist’s Call for Better Visuals Jonathan A. Schwabish Congressional Budget Office jschwabi@yahoo.com @jschwabish October 2012 The views expressed in this presentation are those of the author and should not be interpreted as those of the Congressional Budget Office.
Graphics produced by economists, policy and budget analysts, government agencies… can be better
Klerman and Danielson, Journal of Policy Analysis and Management, 2011
Gokhale, Social Security: A Fresh Look at Policy Alternatives, 2010
Modrek and Cullen, 14th Annual Joint Conference of the Retirement Research Consortium
Sum = 98% Sum = 100% Social Security Administration
Holden and Fontes, Journal of Women, Politics, & Policy, 2009
CBO’s Infographic Demographic • Member of Congress Wants to get specific information on a topic, a broad overview, quick facts, or bullet points. • Congressional Staffer Wants to get data quickly. Might be briefing Member on topics outside usual areas of responsibility.
CBO’s Infographics: Bring the most important information to the top
Understanding the Fiscal Cliff 75 pages 10 pages
The purpose of visualization is insight, not pictures -Card, Mackinlay and Shneiderman (1999)
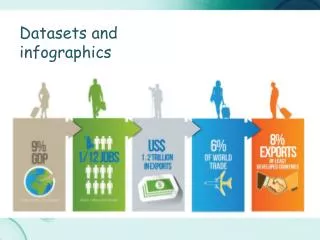
Data Government Agencies Visualization