FINANCIAL RATIOS (using financial statements)
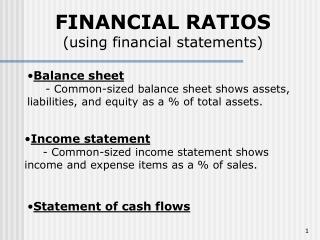
FINANCIAL RATIOS (using financial statements). Balance sheet - Common-sized balance sheet shows assets, liabilities, and equity as a % of total assets. Income statement - Common-sized income statement shows income and expense items as a % of sales. Statement of cash flows.

FINANCIAL RATIOS (using financial statements)
E N D
Presentation Transcript
FINANCIAL RATIOS (using financial statements) • Balance sheet • - Common-sized balance sheet shows assets, • liabilities, and equity as a % of total assets. • Income statement • - Common-sized income statement shows • income and expense items as a % of sales. • Statement of cash flows
FINANCIAL RATIOS (standardized measures) • Used by managers for planning and evaluation • Used by credit managers to assess risk • Used by investors to assess stocks and bonds • Used to compare with industry and over time
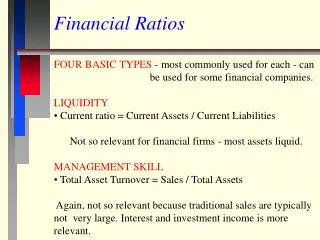
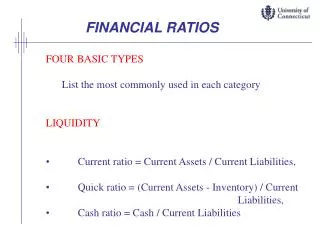
FINANCIAL RATIOSTypes of ratios • Liquidity -ability to meet short term debt • Asset management -efficiency in using resources • Financial leverage management -level of risk due to debt • Profitability -effectiveness in generating profits • Market-based -market’s view of the firm
Liquidity Ratios • Current ratio = Current assets Current liabilities • CR = $50,190 / $25,523 • CR = 1.97 vs. 2.4 Ind. Avg. • Quick ratio = Current assets – inventories Current liabilities • QR = ($50,190 - $27,530) / $25,523 • QR = .89 vs. .92 Ind. Avg.
Asset Management Ratios • Avg collection period = Accounts receivable Annual credit sales/365 • ACP = $18,320 / ($112,760/365) • ACP = 59.3 days vs. 47 days Ind. Avg. • Inventory turnover = Cost of sales Average inventory • Inv. Turn. = $85,300 / ($27,530 + $26,470)/2 • Inv. Turn. = 3.16 vs. 3.9 Ind. Avg.
Asset Management Ratios • Fixed-asset turnover = Sales Net fixed assets • FAT = $112,760 / $31,700 • FAT = 3.56 vs. 4.6 Ind. Avg. • Total asset turnover = Sales Total assets • TAT = $112,760 / $81,890 • TAT = 1.38 vs. 1.82 Ind. Avg.
Financial Leverage Management • Debt ratio = Total debt Total assets • DR = $47,523 / $81,890 • DR = 58% vs. 47% Ind. Avg. • Debt-to-equity ratio = Total debt Total equity • D/E = $47,253 / $34,367 • D/E = 138.3% vs. 88.7% Ind. Avg.
Financial Leverage Management • Times interest earned = EBIT Interest charge • Coverage Ratio = $11,520 / $3,160 • Coverage Ratio = 3.65 vs. 6.7 Ind. Avg. • Equity multiplier = Total assets Total equity • EM = $81,890 / $34,367 • EM = 2.38 vs. 1.89 Ind. Avg.
Profitability Ratios • Gross profit margin = Sales - Cost of sales Sales • GPM = ($112,760 - $85,300) / $112,760 • GPM = 24.4% vs. 25.6% Ind. Avg. • Net profit margin = EAT Sales • NPM = $5,016 / $112,760 • NPM = 4.45% vs. 5.1% Ind. Avg.
Profitability Ratios • ROI = EAT Total Assets • ROI = $5,016 / $81,890 • ROI = 6.13% vs. 9.28% Ind. Avg. • ROE = EAT Stockholders equity • ROE = $5,016 / $34,367 • ROE = 14.6% vs. 17.54% Ind. Avg.
Market-Based Ratios • P/E ratio = Market price per share Current earnings per share • Market to book ratio= Market price per share Book value per share
Dividend Policy Ratios • Payout ratio = Dividends per share EPS • Dividend yield = Expected dividends per share Stock price
Trend analysis20000102 XYZ current ratio 1.9 2.2 2.3 Cross-sectional analysis2002 XYZ current ratio 2.3 Industry averages 2.5 Both simultaneously200001 02 XYZ current ratio 1.9 2.2 2.3 Industry averages 2.5 2.4 2.5 Financial Ratio Analysis
Relationships Among Ratios • ROI = EATSales = EAT Sales Total assets Total assets or • ROI = Net profit Total Asset = NPM TAT margin turnover and • ROE = EATTotal assets = EATTotal assets Equity Equity or • ROE = ROI Equity = ROI EM multiplier
Relationships Among Ratios If • ROE = ROI Equity = ROI EM multiplier and • ROI = Net profit Total Asset = NPM TAT margin turnover then • ROE = Net profit Total Assets Equity margin turnover multiplier or • ROE = NPM TAT EM
Relationships Among Ratios This is the Dupont formula: • ROE = Net profit Total Assets Equity margin turnover multiplier or • ROE = NPM TAT EM
Dupont Formula Example of the Dupont formula: • ROE = NPM TAT EM Company: • 14.6% = 4.45% 1.38 2.38 Industry average: • 17.5% = 5.10% 1.82 1.89
Dun and Bradstreet Robert Morris Associates Prentice-Hall’s Almanac of Business and Industrial Ratios Moody’s Standard and Poor’s Annual reports 10K’s Trade associations Trade journals Commercial banks Financial Research Associates Computerized data bases Sources of Information