Download
1 / 14
140 likes | 237 Vues
Explore how ArcGIS Server and mobile apps can enhance retail availability surveys, uncover discrepancies in data, and stimulate local economic growth. Join our workshop on July 31, 2013, to learn more.

E N D
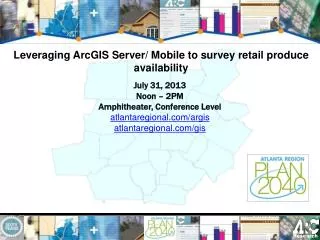
Leveraging ArcGIS Server/ Mobile to survey retail produce availability • July 31, 2013 • Noon – 2PM • Amphitheater, Conference Level • atlantaregional.com/argis • atlantaregional.com/gis
Needs Assessment • “Local” food system research • Food Deserts • Access and Security • Stakeholders • Community • Government • Researchers
Data Model Adapted from Nutrition Environment Measures Survey (NEMS) Glanz et al. (2007) and Cavanaugh et al. (2013)
Platform • ArcGIS Server/SDE 10.1 • Enabled Feature Attachments in SDE • Served MXD • Enabled Feature Access • Increased timeouts • Secure if needed • ArcGIS online • Create new map • Add REST Endpoint • ArcGIS Mobile app • iOS (iPad/iPhone)
Route Tracking • Motion X GPS mobile app • 311 miles
Results .
Results • A total of twenty-two retail outlets were surveyed from January through March 2013. The base ESRI business data contained fourteen retail food outlets, where two were closed and one was unable to be located in the field. • As a result, the rate of ESRI retail food outlets to actual retail outlets on the ground is 55%. With 45% of the total number of retail outlets unaccounted in these proprietary data, such discrepancies could have significant implications for planning and policy decisions. • In addition to the coarse resolution of the ESRI data, the discrepancies in ESRI location data found through ground verification in the study area further reinforces the importance of primary data needs. Unexpected Finding
Implications • Framework can serve as a platform for community and other stakeholders to leverage towards primary data collection and strategic research through participatory GIS • Planning and policy considerations may better facilitate connections between the local agriculture sites and retail opportunities • May serve to stimulate local economic growth, strengthen sustainability and promote positive health outcomes in communities • Scaled across geographies/time