Control Chart for Variables
Control Chart for Variables. Outline. Concept of variation The Control Chart Techniques State of Introduction Control Specifications Process Capability Six Sigma Different Control Charts. variation.

Control Chart for Variables
E N D
Presentation Transcript
Outline Concept of variation The Control Chart Techniques State of Introduction Control Specifications Process Capability Six Sigma Different Control Charts Besterfield Quality Control 8th Ed
variation The variation concept is a law of nature in that no two natural items in any category are the same.
variation Production process ในการผลิตชิ้นงานจำนวนมากค่าข้อมูลที่ได้จากผลิตภัณฑ์แต่ละค่าเช่น น้ำหนัก ความยืดหยุ่น ความแข็ง เป็นต้น จะมีรูปแบบการกระจายของค่าข้อมูลที่มีแน้วโน้มลู่เข้าสู่ค่าที่ควรจะเป็นค่าหนึ่ง () โดยธรรมชาตินั้นค่าข้อมูลที่ได้จากผลิตภัณฑ์แต่ละค่าอาจไม่เท่ากัน เป็นอิสระต่อกันและเบี่ยงเบนไปจากค่า การเบี่ยงเบนนี้มีผลมาจาก สาเหตุสำคัญ2ชนิดคือ สาเหตุจากธรรมชาติ(Chance causeหรือCommon cause)และสาเหตุที่ระบุได้ หรือ สาเหตุที่เกิดจากความผิดผลาด(Assignable cause) Man, Machine, Method Processes(กระบวนการ) • Products • Hardware • Service Raw Materials Variation of products Assignable cause ε Chance cause
variation • The variation may be quite large and easily noticeable • The variation may be very small. It may appear that items are identical; however, precision instruments will show difference • The ability to measure variation is necessary before it can be controlled
variation There are three categories of variation in piece part production: • Within-piece variation: e.g. Surface roughness • Piece-to-piece variation: e.g. Difference in diameters among pieces produced at the same time • Time-to-time variation: e.g. Difference in product produced at different times of the day
variation Sources of Variation in production processes: Men + Materials + Methods + Machines + Environment Measurement Instruments Operators Methods Materials PROCESS INPUTS OUTPUTS Human Inspection Performance Tools Machines Environment
Variation causes Sources of variation are: • Equipment: • Toolwear • Machine vibration • Electrical fluctuations etc. • Material • Tensile strength • Ductility • Thickness • Porosity etc. What do you think are the causes of variation due to equipment? What do you think are the causes of variation due to Materials?
Variation causes Sources of variation are: • Environment • Temperature • Light • Radiation • Humidity etc. • Operator • Personal problem • Physical problem etc. What do you think are the causes of variation due to environment? What do you think are the causes of variation due to Operators?
Variation cause There is also a reported variation which is due to the inspection activity. Variation due to inspection should account for one tenth of the four other sources of variation.
Variation causes Variation may be due to chance causes (random/common causes) or assignable causes. When only chance causes are present, then the process is said to be in a state of statistical control. The process is stable and predictable.(กระบวนการผลิตจะถือว่าอยู่ในสภาวะคงที่หรือมีเสถียรภาพ และสามารถทำนายได้ ก็ต่อเมื่อการเบี่ยงเบนหรือความแปรปรวนที่เกิดขึ้นในการผลิตมาจากสาเหตุธรรมชาติ (Chance cause)เท่านั้น หรืออาจกล่าวได้ว่าถ้ามีการเบี่ยงเบนของกระบวนการที่เกิดจากสาเหตุจากความผิดผลาด (Assignable cause) เราถือว่ากระบวนการยังไม่อยู่ในสภาวะคงที่ ในการควบคุมคุณภาพ (Control Chart) เราจะใช้แผนภูมิควบคุมเพื่อตรวจสอบสภาวะของกระบวนการผลิตว่าอยู่ภายใต้การความคุม และมีเสถียรภาพหรือไม่)
Control Charts • Variable data • x-bar and R-charts • x-bar and s-charts • Charts for individuals (x-charts) • Attribute data • For “defectives” (p-chart, np-chart) • For “defects” (c-chart, u-chart)
Control Charts Continuous Numerical Data Categorical or Discrete Numerical Data Control Charts Variables Attributes Charts Charts R P C X Chart Chart Chart Chart
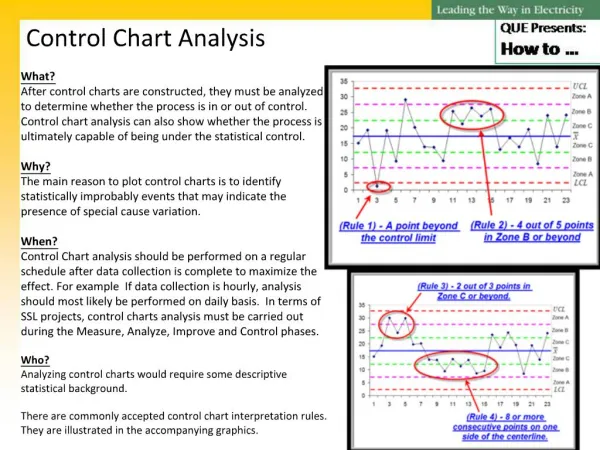
Control Charts for Variables The control chart for variables is a means of visualizing the variations that occur in the central tendency and the mean of a set of observations. It shows whether or not a process is in a stable state.
Control Charts for Variables Figure 5-1 Example of a control chart
Control Charts for Variables Figure 5-2 Example of a method of reporting inspection results
Variable Control Charts The objectives of the variable control charts are: • For quality improvement • To determine the process capability • For decisions regarding product specifications • For current decisions on the production process • For current decisions on recently produced items
Control Chart Techniques Procedure for establishing a pair of control charts for the average Xbar and the range R: • Select the quality characteristic (เลือกข้อมูลที่ได้จากการวัดที่ใช้เป็นตัวกำหนดคุณภาพของชิ้นงาน เช่น ความยาว ความกว้าง เส้นผ่าศูนย์กลาง ความแข็ง เป็นต้น) • Choose the rational subgroup (เลือกกลุ่มตัวอย่างที่เหมาะสม เช่น เลือกความถี่การเก็บข้อมูล และจำนวนข้อมูลของกลุ่มตัวอย่าง ที่เหมาะสม) • Collect the data • Determine the trial center line and control limits (หาค่ากลางและค่าขอบเขตครั้งแรก) • Establish the revised central line and control limits (ปรับค่า ค่ากลางและค่าขอบเขตที่ได้จากการคำนวนครั้งแรกให้เหมาะสม ซึ่งทำได้โดยการกำจัดข้อมูลที่เกิดจาก assignable cause) • Achieve the objective
Rational Subgroup There are two schemes for selecting the subgroup samples: • The instant-time method: Select subgroup samples from product or service produced at one instant of time or as close to that instant as possible • The period-of-time method: Select from product or service produced over a period of time that is representative of all the products or services sampling 2 hr 1 hr 2 hr sampling 2 hr 1 hr 2 hr
Rational Subgroup The first scheme will have a minimum variation within a subgroup. The second scheme will have a minimum variation among subgroups. The first scheme is the most commonly used since it provides a particular time reference for determining assignable causes. The second scheme provides better overall results and will provide a more accurate picture of the quality.
Subgroup Size • As the subgroup size increases, the control limits become closer to the central value, which make the control chart more sensitive to small variations in the process average • As the subgroup size increases, the inspection cost per subgroup increases • When destructive testing is used and the item is expensive, a small subgroup size is required
Subgroup Size • From a statistical basis a distribution of subgroup averages are nearly normal for groups of 4 or more even when samples are taken from a non-normal distribution • When a subgroup size of 10 or more is used, the s chart should be used instead of the R chart. • Theguide for the amount of sampling (or sample size) is show in the next slide ( subgroup size และ sample sizeไม่ใช่สิ่งเดียวกัน subgroup size หมายถึงจำนวนตัวอย่างใน subgroup ส่วน sample sizeหมายถึงจำนวนของของชิ้นงานทั้งหมดที่ถูกสุ่มเก็บข้อมูล)
Subgroup Size Standard: ANSI/ASQ Z1.9-1993 If a process produce 4000 pieces per day, then 75 total inspections (sample size) are suggested. Therefore, if a subgroup size is 4, the number of subgroup is 19 (75/4 ~ 19)