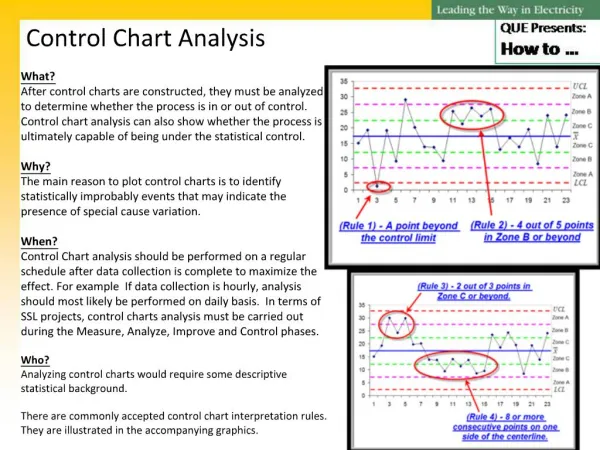
Control Chart (continued)
Control Chart (continued). Type of Attributes Control Chart. Control Chart for Fraction Nonconforming — p chart Control Chart for Nonconforming — np chart Control Chart for Nonconformities — c chart Control Chart for Nonconformities per unit — u chart.

Control Chart (continued)
E N D
Presentation Transcript
Type of Attributes Control Chart • Control Chart for Fraction Nonconforming —p chart • Control Chart for Nonconforming —np chart • Control Chart for Nonconformities —c chart • Control Chart for Nonconformities per unit —u chart
Control Charts for Fraction Nonconforming • Control charts for fraction nonconforming are based on the binomial distribution. • The fraction-defective p chart can be used for any two-state (dichotomous) process such as heavy versus light, acceptable versus unacceptable, on-time versus late, or placed properly versus misplaced.
Sample size of fraction nonconforming control chart • If p is very small, we should choosen sufficiently large(usually larger than 100) so that we have a high probability of finding at least one nonconforming unit in the sample. • Otherwise, we might find that the control limits are such that the presence of only one nonconforming unit in the sample would indicate an out-of control condition.
Sample size of fraction nonconforming control chart • If P=0.01, n=8, then UCL=0.1155 • If there is one nonconforming unit in the sample, then p=1/8=0.1250, and we can conclude that the process is out of control. • Therefore, a sample size of 100 would have to be taken to expect to include even one defective item.
nmin≥ /2 nmax≤2 Variable Sample Size of fraction nonconforming control chart • The data used to derive the control chart does not have to use the same size sample as is collected to use the chart. • Control charts based on the average sample size results in an approximate set of control limits. • The average sample size is given by • The average sample size is given by
Control Charts for Fraction Nonconforming • Although the fraction defective follows the binomial distribution, if is near 0.5, or n is “large” (greater than 30 or so), the normal distribution is a good approximation and the control limits of 3 will remain 99.7% of the sample observations. • The LCL cannot be negative.
The np control chart • The actual number of nonconforming can also be charted. Let n = sample size, p = proportion of nonconforming. The control limits are: (if a standard, p, is not given, use )
Example of np chart • The nonconforming data of some part is listed in the right table. Sample size n=100
Example of np chart CL: 2.6 UCL: LCL:
Control Charts for Nonconformities (Defects) • There are many instances where an item will contain nonconformities but the item itself is not classified as nonconforming. • There is a single situation in which any number of incidents may occur, each with a small probability. Typical of such incidents are scratches in tables, fire alarms in a city, typesetting errors in a newspaper. • It is often important to construct control charts for the total number of nonconformities or the average number of nonconformities for a given “area of opportunity”. The inspection unit must be the same for each unit.
Control Charts for Nonconformities (Defects) Poisson Distribution • The number of nonconformities in a given area can be modeled by the Poisson distribution. Let c be the parameter for a Poisson distribution, then the mean and variance of the Poisson distribution are equal to the value c. • The probability of obtaining x nonconformities on a single inspection unit, when the average number of nonconformities is some constant, c, is found using:
c-chart • Standard Given: • No Standard Given: Again, the normal distribution is used as an approximation to derive control limits with a minimum LCL of zero.
Control Chart for Nonconformities per unit (u chart) • If we find c total nonconformities in a sample of n inspection units, then the average number of nonconformities per inspection unit is u = c/n. • The control limits for the average number of nonconformities is
u chart: Variable Width Control Limits • Determine for all samples • The upper and lower control limits are
nmin≥ /2 nmax≤2 Control limits of u chart based on an average sample size • Control charts based on the average sample size results in an approximate set of control limits. • The average sample size is given by • The upper and lower control limits are
Type of Variables Control Chart • Variable - a single quality characteristic that can be measured on a numerical scale. • When working with variables, we should monitor both the mean value of the characteristic and the variability associated with the characteristic.
Control Charts for and R Notation for variables control charts n - size of the sample (sometimes called a subgroup) chosen at a point in time m - number of samples selected = average of the observations in the ith sample (where i = 1, 2, ..., m) = grand average or “average of the averages (this value is used as the center line of the control chart) Ri = range of the values in the ith sample Ri = xmax - xmin = average range for all m samples
Factors to determine control limits Constant Table
Trial Control Limits • The control limits obtained from equations should be treated as trial control limits. • If this process isin control for the m samples collected, then the system was in control in the past. • If all points plot inside the control limits and no systematic behavior is identified, then the process was in control in the past, and the trial control limits are suitable for controlling current or future production.
Trial control limits and the out-of-control process • If points plot out of control, then the control limits must be revised. • Before revising, identify out of control points and look for assignable causes. • If assignable causescan be found, then discard the point(s) and recalculate the control limits. • If no assignable causescan be found then 1) either discard the point(s) as if an assignable cause had been found or 2) retain the point(s) considering the trial control limits as appropriate for current control. If future samples still indicate control, then the unexplained points can probably be safely dropped.
Revision of Control Limits and Center Line • The and R charts give information about the capability of the process relative to its specification limits. • The effective use of control chart will require periodic revision of the control limits and center lines. • Every week, every month, or every 25, 50, or 100 samples. • When revising control limits, it is highly desirable to use at least 25 samples or subgroups in computing control limits. • If the R chart exhibits control, the center line of the Chart will be replaced with a target value. This can be helpful in shifting the process average to the desired value.
Phase II Operation of Charts • Use of control chart for monitoring future production, once a set of reliable limits are established, is called phase II of control chart usage • A run chart showing individuals observations in each sample, called a tolerance chart or tier diagram, may reveal patterns or unusual observations in the data
Control Limits, Specification Limits, and Natural Tolerance Limits • Control limits are functions of the natural variability of the process • Natural tolerance limits represent the natural variability of the process (usually set at 3-sigma from the mean) • Specification limits are determined by developers/designers. • There is no mathematical relationship between control limits and specification limits.
Necessity of monitoring both the mean and the variability of a process • X bar chart monitors the between sample variability (variability in the process over time). • Sample should be selected in such a way that maximizes the chances for shifts in the process average to occur between samples. • R chart monitors the within sample variability (the instantaneous process variability at a given time). • Samples should be selected so that variability within samples measures only chance or random causes.
Necessity of monitoring both the mean and the variability of a process Sample Data of Weights of Tacos (ounces) Made at a fast-food restaurant Three samples are taken each day: one during the lunch-hour rush, one during the dinner-hour rush, and one during a couple of hours before the restaurant is closed. Each sample consists of three tacos randomly selected from a bin that stores completed tacos waiting to be sold to customers.
Necessity of two control charts • In the normal distribution, the parameter µ and σ are independent of each other. Controlling the normal distribution has to be realized by respectively controlling µ and σ • Therefore, there has to be two control charts for µ and σ in the control charts based on the normal distribution. • When it comes to binomial and poisson distribution, it’s not necessary to use two control charts.
Guidelines for the Design of the Control Chart Allocating Sampling Effort • Choose a larger sample size and sample less frequently? or, Choose a smaller sample size and sample more frequently? • The method to use will depend on the situation. In general, small frequent samples are more desirable. • For economic considerations, if the cost associated with producing defective items is high, smaller, more frequent samples are better than larger, less frequent ones.
Guidelines for the Design of the Control Chart • If the rate of production is high, then more frequent sampling is better. • If false alarms or type I errors are very expensive to investigate, then it may be best to use wider control limits than three-sigma. • If the process is such that out-of-control signals are quickly and easily investigated with a minimum of lost time and cost, then narrower control limits are appropriate.
Based on Standard deviation The sample size is n and k samples are collected
Constant Table Chart: S Chart: Note: A1* can also be referred as A3
The Shewhart Control Chart for Individual Measurements • What if you could not get a sample size greater than 1 (n =1)? Examples include • Automated inspection and measurement technology is used, and every unit manufactured is analyzed. • The production rate is very slow, and it is inconvenient to allow samples sizes of N > 1 to accumulate before analysis • Repeat measurements on the process differ only because of laboratory or analysis error, as in many chemical processes. • The X and MR charts are useful for samples of sizes n = 1.
The Shewhart Control Chart for Individual Measurements Moving Range Chart • The moving range (MR) is defined as the absolute difference between two successive observations: Ri = |xi - xi-1| which will indicate possible shifts or changes in the process from one observation to the next.
X-chart Collecting data and each data forms a sample When n=2, then d2=1.128, v2=0.853
X-chart 3.27 —
Relationship of control limits and specification limits • For charts,do not plot specification limits on the charts, since it is no use when the average value of the points beyond the control limits is just within the limits. So it will cause confusion between control and capability • If individual observations are plotted, then specification limits may be plotted on the chart.
Choice Between Attributes and Variables Control Charts • Each has its own advantages and disadvantages • Attributes data is easy to collect and several characteristics may be collected per unit. • Variables data can be more informative since specific information about the process mean and variance is obtained directly. • Variables control chartsprovide an indication of impending trouble (corrective action may be taken before any defectives are produced). • Attributes control charts will not react unless the process has already changed (more nonconforming items may be produced).
Guidelines for Implementing Control Charts • Determine which process characteristics to control. • Determine where the charts should be implemented in the process. • Choose the proper type of control chart. • Take action to improve processes as the result of SPC/control chart analysis. • Select data-collection systems and computer software.
Application of Control Charts • The control chart, though originally developed for quality control in manufacturing, is applicable to all sorts of repetitive activities in any kind of organization. • It can be used for services as well as products, for people, machines or cost, and so on.