SXC control chart
SXC control chart. 指導教授:童超塵 作者: Zhang Wu, Ming Xie, Qingchuan Lin and Yu Zhang 主講人:廖莉芳. The International Journal of Advanced Manufacturing Technology Volume 30, Numbers 5-6 / September, 2006. Outline. Introduction Design of the SXC chart

SXC control chart
E N D
Presentation Transcript
SXC control chart 指導教授:童超塵 作者:Zhang Wu, Ming Xie, Qingchuan Lin and Yu Zhang 主講人:廖莉芳 The International Journal of Advanced Manufacturing Technology Volume 30, Numbers 5-6 / September, 2006
Outline • Introduction • Design of the SXC chart • Comparative studies • Conclusions and discussions
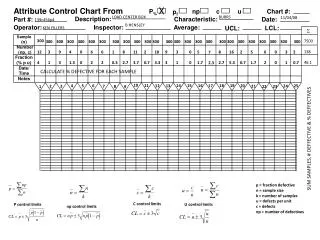
Introduction • SXC (sum of xs with curtailment) control chart. • as simple as the X-bar chart ; as effective as the CUSUM chart
Design of the SXC chart • Some parameters need to be specified: • Calculation of ATS • Two key samples: • Shifting sample – mean shift takes place • Signalling sample – mean shift is detected
Design of the SXC chart • The steps for calculating ATS are outlined below. (1) Calculate p(m) • p(m) is the probability that the mean shift is detected after inspecting the mth unit in the signalling sample (2) Calculate Q • Q is the probability that the out-of-control condition is detected in a single sample. (3) Calculate q • q is the average number of units inspected in the signalling sample. (4) Finally,compute ATS
Design of the SXC chart • The optimization design of the SXC chart • How to choose n? • The sample size n will be increased from Nmin in step of one until ATS can not be further reduced. • The steps are outlined below:
Comparative studies • Compares the performance of three control, X-bar chart、CUSUM chart and the SXC chart. • The sample size and control limits of all the charts are determined by the same optimization model. • Nmin =4 • Study one • τ=1850 (ARL0=370 and n=5) • 0.0≦δ ≦3.4
Comparative studies • There are several interesting findings: • ATS0 that are very close toτ (=1850) • very similar false alarm rates • When the mean shift becomes large, the curtailment mechanism enables the SXC chart to signal the out-of-control condition before all of the n units in a sample are inspected. • The ATS values of the two charts do not differ significantly for any given mean shift value.
Conclusions and discussions • SXC 管制圖比X-bar管制圖好,平均可縮短74%的ATS。 • 雖然SXC跟CUSUM管制圖效率差不多,但是SXC管制圖比較簡單。 • 即使換成random inspection或uniform inspection 結果也差不多。 • 也許可以將相同的手法用在R或其他管制圖上