CONTROL CHART BASIS
CONTROL CHART BASIS. BPT2423 – STATISTICAL PROCESS CONTROL. CHAPTER OUTLINE. Control Chart Functions Variation Basic Principles Choice of Control Limits Upper Control Limit (UCL) Lower Control Limit (LCL) Sample Size and Sampling Frequency Rational Subgroups Analysis of Patterns.

CONTROL CHART BASIS
E N D
Presentation Transcript
CONTROL CHART BASIS BPT2423 – STATISTICAL PROCESS CONTROL
CHAPTER OUTLINE • Control Chart Functions • Variation • Basic Principles • Choice of Control Limits • Upper Control Limit (UCL) • Lower Control Limit (LCL) • Sample Size and Sampling Frequency • Rational Subgroups • Analysis of Patterns
LESSON OUTCOMES • Understand the concept of variation • Explain the statistical basis of the control chart, including control limits and rational subgroup concept • Identify some practical issues in the implementation of statistical process control
CONTROL CHART FUNCTIONS • A control chart enhances the analysis of the process by showing how the process is performing over time • Serve 2 basic functions: • Control charts are decision making tools Provide an economic basis for making a decision as to whether to investigate for potential problems; to adjust the process or to leave the process alone • Control charts are problem-solving tools Point out where improvement is needed and help to provide a statistical basis on which to formulate improvement actions
CONTROL CHART FUNCTIONS • Control charts have had a long history of use in U.S. industries; Five reasons for it popularity: • Control charts are a proven technique for improving productivity • Control charts are effective in defect prevention • Control charts prevent unnecessary process adjustment • Control charts provide diagnostic information • Control charts provide information about process capability
VARIATION • Definition : Where no two items / services are exactly the same • The goal of most processes is to produce products or provide services that exhibit little or no variation • Several types of variation are tracked with statistical methods: • Within-piece : variation within a single item or surface • Piece-to-piece : variation that occurs among pieces produced at approximately the same item • Time-to-time : variation in the product produced at different times of the day • Variation in a process is studied by sampling the process; understanding variation and its causes results in better decisions
VARIATION Stable and Unstable Variation
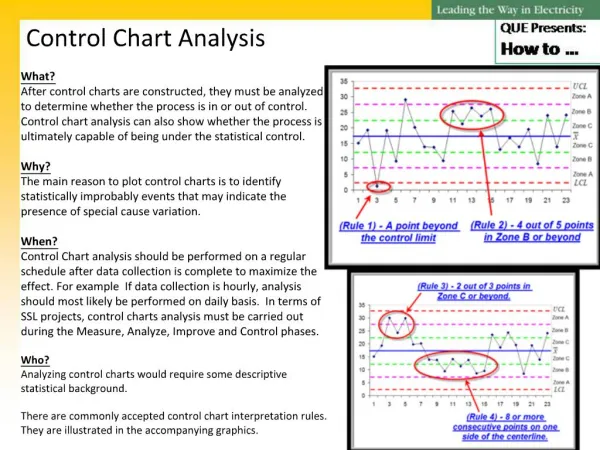
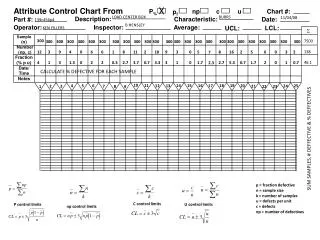
BASIC PRINCIPLES The Chart contains: • Center line that represents the average value of the quality characteristics corresponding to the in-control state • Two other horizontal lines, called the upper control limit (UCL) and the lower control limit (LCL) • All the sample points on the control chart are connected with straight-line segments, so that it’s easier to visualize how the sequence of points has evolved over time
BASIC PRINCIPLES • If the process is in control, nearly all of the sample points will fall between chosen control limits and no action is necessary • However, a point that plots outside of the control limits is interpreted as evidence that the process is out of control, investigation and corrective action are required to find and eliminate the causes • Even if all the points plot inside the control limits, if they behave in a systematic or non random manner, then this could be an indication that the process is out of control • If the process is in control, all the plotted points should have an essentially random pattern
CHOICE OF CONTROL LIMITS • 99.73% of the data under a normal curve falls within ± 3σ; because of this, control limits are established at ± 3σ from the centerline of the process • Let w be a sample statistic that measures some quality characteristic of interest, and suppose that the mean of w is µw and the standard deviation of w is σw • Formula: Upper Control Limit (UCL) = µw+ 3σw Center Line = µw Lower Control Limit (LCL) = µw– 3σw
SAMPLE SIZE AND SAMPLING FREQUENCY • In designing a control chart, sample size and the frequency of sampling must be specify • In general, larger samples will make easier to detect small shifts in the process • When choosing the sample size, user must keep in mind the size of the ‘shift’ that are trying to detect • The most desirable situation form the point of view of detecting shifts would be to take large samples very frequently (not economic feasible) • General problem is one of allocating sampling effort – either take small samples at short intervals or larger samples at longer intervals
SAMPLE SIZE AND SAMPLING FREQUENCY • Average run length (ARL) can be use to evaluate the decisions regarding sample size & sampling frequency of the control chart • ARL is the average number of points that must be plotted before a point indicates an out-of-control condition by using formula: ARL = 1/p where p is the probability that any point exceeds the control limits
SAMPLE SIZE AND SAMPLING FREQUENCY • Example: Chart with 3σ limits, p=0.0027 : the probability that a single point falls outside the limits when the process is in control ARL = 1/p = 1/0.0027 = 370 which means an out-of-control signal will be generated every 370 samples, on the average
RATIONAL SUBGROUPS • Subgroups and the samples composing them must be homogeneous • A homogeneous subgroup will have been produced under the same conditions, by the same machine, the same operator, the same mold and so on • Subgroups used in investigating piece-to-piece variation will not necessarily be constructed in the same manner as subgroups formed to study time-to-time variation • Subgroup formation should reflect the type of variation • When constructing variables chart, keep the subgroup sample size constant for each subgroup taken
RATIONAL SUBGROUPS Some guidelines to be followed • The larger the subgroup size, the more sensitive the chart becomes to small variations in the process average. This provide a better picture of the process since it allows the investigator to detect changes in the process quickly • While a larger subgroup size makes for a more sensitive chart, it also increases inspection costs • Destructive testing may make large subgroup sizes unfeasible • Subgroup sizes smaller than four do not create a representative distribution of subgroup averages
ANALYSIS OF PATTERNS A control chart exhibits a state of control when: • 2/3 of the points are near the center value • A few of the points are on or near the center value • The points appear to float back and forth across the centerline • The points are balanced (in roughly equal numbers) on both sides of the centerline • There are no points beyond the control limits • There are no patterns or trends on the chart A process that is not under control or is unstable, displays patterns of variation - the process need to be investigate and determine if an assignable cause can be found for the variation
ANALYSIS OF PATTERNS Patterns in Control Chart: • Oscillating • Change / Jump / Shift • Runs • Recurring Cycles • Freaks / Drift
ANALYSIS OF PATTERNS Example : Change / Jump / Shift Description: The process begins at one level and jump quickly to another level as the process continues to operate. Causes for sudden shifts in level tend to reflect some new and significant difference in the process. Possible causes : New operator, new batches of raw material or changes to the process settings
ANALYSIS OF PATTERNS Example: Runs