Statistical Analysis of Defective Samples Using Control Charts
This document outlines a comprehensive analysis of defective samples through control charts. It includes key statistical attributes such as average, lower control limits (LCL), and upper control limits (UCL) based on specific sample sizes and defect rates. The analysis provides insights into the fraction defective, number of defectives, and control limits for monitoring quality in production. By applying these statistical criteria, businesses can ensure product quality and minimize defects, ultimately improving operational efficiency and customer satisfaction.

Statistical Analysis of Defective Samples Using Control Charts
E N D
Presentation Transcript
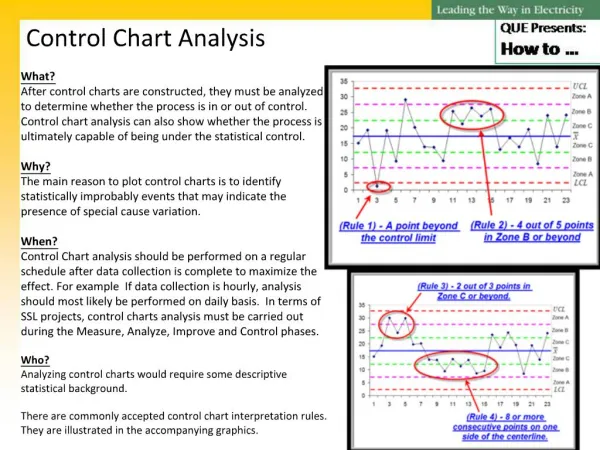
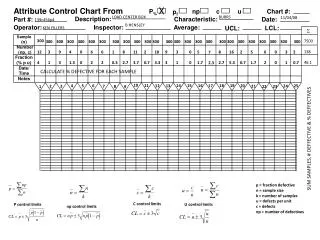
Description: Characteristic: 12 4 3 1 9 3 4 1.3 0 0 6 2 6 2 1 0.3 8 2.7 11 3.7 2 0.7 10 3.3 9 3 3 1 0 0 5 1.7 8 2.7 16 5.3 2 0.7 5 1.7 6 2 0 0 3 1 2 0.7 7 2.3 Attribute Control Chart From P% np c u Chart #: pf X LOAD CENTER BOX BURRS 11/04/08 Part #: Date: 139c456p4 B HENSLEY Operator: Inspector: Average: LCL: UCL: KEN FILLERS Sample (n) 300 7500 300 300 300 300 300 300 300 300 300 300 300 300 300 300 300 300 300 300 300 300 300 300 300 300 Number (np, c) 138 Fraction (% p u) 46.1 Date/ Time CALCULATE % DEFECTIVE FOR EACH SAMPLE Notes 10 11 14 19 15 16 18 4 5 6 12 13 17 20 25 24 2 3 7 21 8 23 1 9 22 SUM SAMPLES, # DEFFECTIVE & % DEFFECTIVES p = fraction defective n = sample size k = number of samples u = defects per unit c = defects np = number of defectives C control limits P control limits U control limits np control limits