Nursing Home Falls Control Chart Analysis Using P-Chart Methodology
This document outlines the process for creating and interpreting a control chart for fall incidents in a nursing home facility. We will utilize a p-chart to monitor the rate of falls among patients, as the statistic of interest is the fall rate, rather than the number of falls. All calculations are dynamic; modifying the input data will automatically update all associated formulas and charts. Key steps include calculating the grand proportion of falls, verifying assumptions, determining control limits, and finally, constructing the control chart for visualization.

Nursing Home Falls Control Chart Analysis Using P-Chart Methodology
E N D
Presentation Transcript
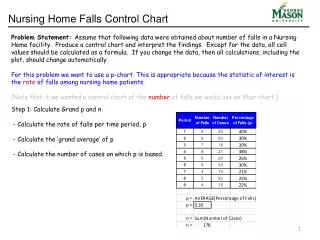
Nursing Home Falls Control Chart • Problem Statement: Assume that following data were obtained about number of falls in a Nursing Home facility. Produce a control chart and interpret the findings. Except for the data, all cell values should be calculated as a formula. If you change the data, then all calculations, including the plot, should change automatically. • For this problem we want to use a p-chart. This is appropriate because the statistic of interest is the rate of falls among nursing home patients. • (Note that if we wanted a control chart of the numberof falls we would use an Xbar chart.) Step 1: Calculate Grand p and n - Calculate the rate of falls per time period, p - Calculate the ‘grand average’ of p - Calculate the number of cases on which p is based.
Nursing Home Falls Control Chart • Problem Statement: Assume that following data were obtained about number of falls in a Nursing Home facility. Produce a control chart and interpret the findings. Except for the data, all cell values should be calculated as a formula. If you change the data, then all calculations, including the plot, should change automatically. Step 2: Check Assumptions • Sample observations are independent – Knowing that one person fell does not give any intuition as to whether someone else will fall. • Success / Failure Condition met? • np = 176 * 0.3 = 53 • n(1-p) = 176 * (1-0.3) = 123 • Yes, the Success / Failure Condition is Met. • Since these conditions are met we can assume that the sampling distribution is nearly normal.
Nursing Home Falls Control Chart • Problem Statement: Assume that following data were obtained about number of falls in a Nursing Home facility. Produce a control chart and interpret the findings. Except for the data, all cell values should be calculated as a formula. If you change the data, then all calculations, including the plot, should change automatically. Step 3: Calculate Standard Error by Time Period – Recall that for each time period...
Nursing Home Falls Control Chart • Problem Statement: Assume that following data were obtained about number of falls in a Nursing Home facility. Produce a control chart and interpret the findings. Except for the data, all cell values should be calculated as a formula. If you change the data, then all calculations, including the plot, should change automatically. … Next, Calculate the control limits. Recall that we want to use the test statistic for a 95% confidence interval for each time period. This is Z=1.96.
Nursing Home Falls Control Chart • Problem Statement: Assume that following data were obtained about number of falls in a Nursing Home facility. Produce a control chart and interpret the findings. Except for the data, all cell values should be calculated as a formula. If you change the data, then all calculations, including the plot, should change automatically. Step 4: Draw the Control Chart a) Highlight the Number of Falls, then the control limits. b) Choose ‘Insert’ ‘Line’ Chart … … it produces this. Need to make it look like a control chart.
Nursing Home Falls Control Chart • Problem Statement: Assume that following data were obtained about number of falls in a Nursing Home facility. Produce a control chart and interpret the findings. Except for the data, all cell values should be calculated as a formula. If you change the data, then all calculations, including the plot, should change automatically. Step 6: Draw the Control Chart • d) Clean up the lines – eliminate the line among the fall data and eliminate the markers along the control limits. • Highlight a line. I’ve done the UCL here. • Right Click on the line and choose ‘format data series’. Choose ‘marker options’ and highlight ‘none’. Repeat for the other control limit.
Nursing Home Falls Control Chart • Problem Statement: Assume that following data were obtained about number of falls in a Nursing Home facility. Produce a control chart and interpret the findings. Except for the data, all cell values should be calculated as a formula. If you change the data, then all calculations, including the plot, should change automatically. Step 6: Draw the Control Chart • d) Continued… • Make both control limits red. Let’s do the UCL. Highlight the line. Choose ‘format data series’. Choose ‘Line color’, choose ‘solid line’, and choose red. Repeat for the other control limit. • This produces the following.
Nursing Home Falls Control Chart • Problem Statement: Assume that following data were obtained about number of falls in a Nursing Home facility. Produce a control chart and interpret the findings. Except for the data, all cell values should be calculated as a formula. If you change the data, then all calculations, including the plot, should change automatically. Step 6: Draw the Control Chart • d) Continued… • Recall we just want one legend entry as ‘control limit’. Right now we have LCL and UCL. Double click on one and delete it. I’ve eliminated the UCL. Go to the data table and change ‘Lower Control Limit’ to ‘Control Limit’. It will change the picture.
Nursing Home Falls Control Chart • Problem Statement: Assume that following data were obtained about number of falls in a Nursing Home facility. Produce a control chart and interpret the findings. Except for the data, all cell values should be calculated as a formula. If you change the data, then all calculations, including the plot, should change automatically. Step 6: Draw the Control Chart • d) Continued… • Add a title and axis descriptions by clicking on the graph which will bring up the ‘chart tools’ menu options. Choose ‘Chart Title’ and ‘Axis Titles’ to add these.
Nursing Home Falls Control Chart • Problem Statement: Assume that following data were obtained about number of falls in a Nursing Home facility. Produce a control chart and interpret the findings. Except for the data, all cell values should be calculated as a formula. If you change the data, then all calculations, including the plot, should change automatically.