Download
1 / 7
70 likes | 190 Vues
This study examines the trophic relationships within Lake Nakuru, Kenya, during two distinct ecological phases, focusing on biomass flows using the ECOPATH model. The research highlights significant periods between 1972-1978 characterized by high productivity and subsequent declines, attributed to fluctuating physico-chemical properties. Observations reveal interactions among various species, including pelicans, flamingos, and zoobenthos, reflecting dynamic ecosystems. Despite biomass changes, the global trophic structure remains stable, underscoring the lake's ongoing ecological transformation.

E N D
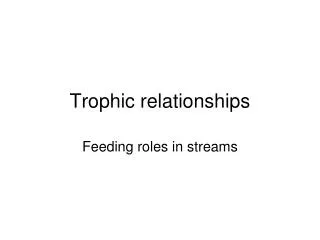
Trophic relationships inside the lake Nakuru during two different phases. Journal Article: Moreau, J, K. Mavuti and T. Daufresne (2001) A Synoptic Ecopath model of biomass flows during two different static ecological situations in Lake Nakuru (Kenya) Hydrobiologia Volume 458, 63-74.
Nakuru lake is situated in the Gregory rift in Kenya. • Sudden changes in physico-chemical characteristics. • Studied by a group of German Scientists: E. Vareschi, J. Jacobs . • No ‘normal’ lake Nakuru: constant changing, unpredictable pattern.
Two successive Phases • 1972-1973: High water level – High productivity of all trophic components. • 1974-1975: Period of low productivity. • 1976-1978: Period of recovery. • Using the ECOPATH model tried : 1)to provide model representations corresponding to the two critical periods. 2) See what impact the changing of the biomass of a main group has on the lake. 3) Approach the general pattern of changes.
Ecopath: Free ecosystem modelling software • comprises species of common physical habitat, similar diet, and life history characteristics into ‘’boxes’’. • They assumed that in each of the two periods the ecosystem was near equilibrium conditions. • All key data were obtained from published literature on the lake itself ( mostly from E. Vareschi, J Jacobs studies).
Groups used in Ecopath • Pelicans , Minor birds,Greater Flamingos, lesser Flamingos. • Rotifers, Zoobenthos, Heteroptera, Copepods. • CyanobacteriumS.Platensis,, nanoplakton, benthic algae, detritus.
Some Results • Codependence between living communities. • Pelicans population stable • Decrease of the population of S. Platensisin 1974 the cause of lesser flamingos migration. • Collapse of copepods the cause of greater Flamingos migration. • The collapsing of S.Platensis in 1974 the cause of the increase in benthic algae, detritus and nanoplakton • In late 1974, increase of benthic algae and detritus the cause of zoobenthos development and return of greater flamingos.
Transfer efficiencies very similar in both phases. • Global trophic Structure remains similar despite the changes of abundance of the various groups between the two phases. • This partly explains the survival of Lake Nakuru ecosystem. • Reason of sudden collapse of S. Platensis and Copepods not clear. • The reasons of the spectacular changes not only physicochemical but also Biological. • Lake Nakuru is STILL CHANGING!!!