Download
1 / 38
380 likes | 661 Vues
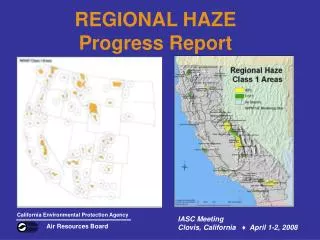
Tracking Visibility Changes with Chemical Species for Regional Haze Planning. WRAP Regional Haze Planning Work Group June 29, 2017 Pat Brewer (NPS ARD) Tom Moore (WESTAR and WRAP). PRELIMINARY DESIGN VALUES by COUNTY* (AQS data 2013 – 2015). *Based on monitor with highest value in county.

E N D
Tracking Visibility Changes with Chemical Species for Regional Haze Planning WRAP Regional Haze Planning Work Group June 29, 2017 Pat Brewer (NPS ARD) Tom Moore (WESTAR and WRAP)
PRELIMINARY DESIGN VALUES by COUNTY* (AQS data 2013 – 2015) *Based on monitor with highest value in county Alaska and Hawaii at reduced scale
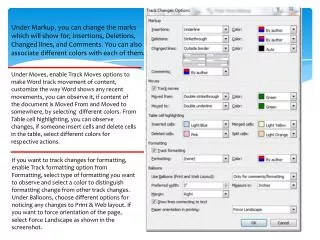
Proposed Revised Tracking Metric for 20% most impaired days Mount Rainier National Park
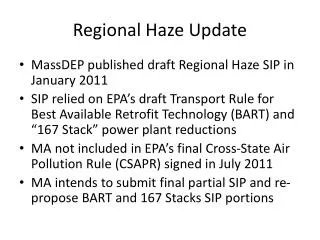
Metric is a new approach to track Progress to Natural Conditions (?) (not fully released / finalized) • (used to be) 20% Worst & Best annual average visibility days • W & B based on 24ish samples/year, 5-year average baseline for planning • RHR plans addressed those targets - objective, extreme ends of monitoring data • Unchanged for more than 30 years until 2016 • Now Visibility Impairment is going to be a Relative Contribution • Any humanly perceptible change in visibility (light extinction, visual range, contrast, coloration) from that which would have existed under natural conditions. • So, much different than the impairment a visitor is actually experiencing • For Regional Haze planning, states can decide to use their metric of choice – complex choice for future discussion.
Regional haze is cumulative impact from many diverse emissions sources EPA proposes/d to use IMPROVE monitoring data to track progress on most impaired days • Days with highest fraction of total haze attributed to anthropogenic emissions (defined via chemical species on filter) • “Natural Haze” (again defined via chemical species) is to be divided into 2 parts: • Routine – background natural haze levels that occur on most days of the year. The values are more consistent from year to year and result from a mix of natural sources including vegetation, long range transported smoke, “typical” wind blown dust, etc. • Episodic – Relatively infrequent natural haze events that add to the routine levels. Episodes generally differ in size, number and time of occurrence from year to year, e.g. smoke and dust events Light Extinction (Bext) Anthropogenic Natural Haze One day of reconstructed haze
Statistical apportionment of IMPROVE monitoring data • Split estimated natural from anthropogenic pollutant contribution • Episodic natural carbon and dust (wildfire and dust storms): daily values > 95th % of site’s 2000-2014 data • Routine daily natural: constant fraction of daily site- specific pollutant data • Pollutants that are not defined as natural, are presumed to be from U.S. anthropogenic sources • Contributions from international emissions are not separated from U.S. anthro impairment • Uncertainty in source allocation of carbon and dust
Wildland fire impacts air quality… can we remove influence of fire on visibility tracking metric? Rim Fire, Yosemite National Park, 2013
Reuben Garrett Lucius "Rube" Goldberg (July 4, 1883 – December 7, 1970) was an American cartoonist, sculptor, author, engineer, and inventor. Goldberg is best known for a series of popular cartoons depicting complicated gadgets that perform simple tasks in indirect, convoluted ways, giving rise to the term Rube Goldberg machines for any similar gadget or process.
WRAP Regional Haze – Technical Support System (TSS)http://vista.cira.colostate.edu/TSS/Results/HazePlanning.aspx
WRAP Regional Haze – Technical Support System (TSS)http://vista.cira.colostate.edu/TSS/Results/HazePlanning.aspx
Light Extinction, 1/Mm Light Extinction, 1/Mm
Light Extinction, 1/Mm Light Extinction, 1/Mm
Light Extinction, 1/Mm Light Extinction, 1/Mm
Light Extinction, 1/Mm Light Extinction, 1/Mm
Light Extinction, 1/Mm Light Extinction, 1/Mm
Haziest days and most impaired days: • Same days in the East • Different days, different • pollutants in the West
Preview of how the days selected for Regional Haze planning at each Class I areas are evaluated with regional photochemical modeling
Most Impaired Days mostly eliminate Summer days (wildfire, dust) Shift to Fall and Winter days (nitrate and sulfate) Black Diamonds indicate 20% Worst Visibility Days Red Diamonds indicate 20% Most Impaired Days
Source apportionment model results for Worst vs. Most Impaired quintiles
CAMx most impaired days visibility metric approach using 2008 and 2011 modeling results • 2008 CAMx PSAT source apportionment modeling for WestJumpAQMS; https://www.wrapair2.org/WestJumpAQMS.aspx) • 2011 CAMx PSAT for Western Air Quality Study (WAQS) available through the Intermountain West Data Warehouse (IWDW; http://views.cira.colostate.edu/tsdw/) • Controllable: • U.S. Anthropogenic Emissions • U.S. Agricultural Burning • Uncontrollable: • Biogenic, Sea Salt, Lightning, WBD • Wildfires and Prescribed Burns • Non-U.S. Anthro Emissions (Mex/Can) • Boundary Conditions (International Transport)
Key Questions for Round 2 RHR Planning • What are visibility trends 2000-present? • Which pollutants are most important? • Implement new tracking metric • Which emissions are most important? • Apply source attribution model • Reconcile links between emissions and haze • Vary by season, meteorology, transport, into future • International emissions are both anthro and natural • Need model to investigate in-state, interstate, non-US anthropogenic, natural contributions
Is Fire a Natural or Anthropogenic Source? It depends…. http://www.ecy.wa.gov/programs/air/indoor_woodsmoke/smoke_page.htm
Regional collaboration is essential for sound science and policy Yosemite National Park - Cathedral Rocks