
Elemental Analysis - Atomic Spectroscopy
E N D
Presentation Transcript
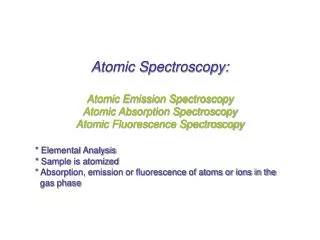
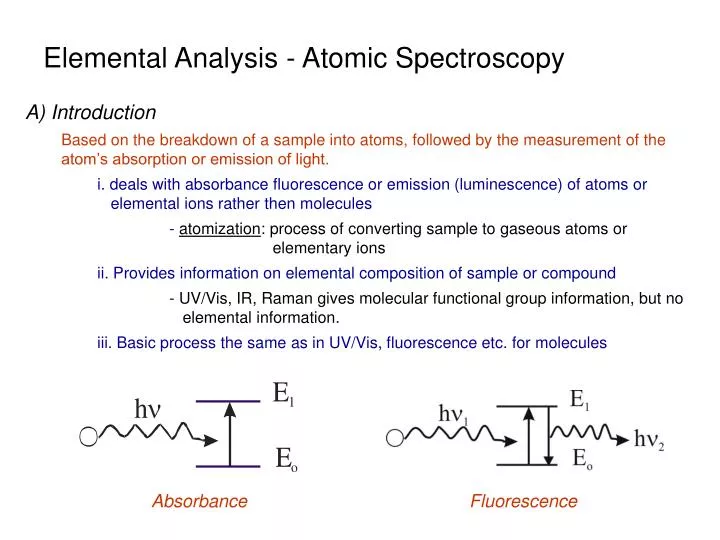
Elemental Analysis - Atomic Spectroscopy A) Introduction Based on the breakdown of a sample into atoms, followed by the measurement of the atom’s absorption or emission of light. i. deals with absorbance fluorescence or emission (luminescence) of atoms or elemental ions rather then molecules - atomization: process of converting sample to gaseous atoms or elementary ions ii. Provides information on elemental composition of sample or compound - UV/Vis, IR, Raman gives molecular functional group information, but no elemental information. iii. Basic process the same as in UV/Vis, fluorescence etc. for molecules Absorbance Fluorescence
iv. Differences for Molecular Spectroscopy - no vibration levels much sharper absorbance, fluorescence, emission bands - position of bands are well-defined and characteristic of a given element - qualitative analysis is easy in atomic spectroscopy (not easy in molecular spectroscopy) Examples: carbon oxygen nitrogen
B) Energy Level Diagrams energy level diagram for the outer electrons of an element describes atomic spectroscopy process. i. every element has a unique set of atomic orbitals ii. p, d, f split by spin-orbit coupling iii. Spin (s) and orbital (l) motion create magnetic fields that perturb each other (couple) - parallel higher energy; antiparallel lower energy • Similar pattern between atoms but different spacing • Spectrum of ion different to atom • Separations measured in electronvolts (eV) 1eV = 1.602x10⁻¹⁹ J = 96.484 kJ ×mol-1 • As number of electrons increases, number of levels increases emission spectra more complex Li 30 lines Cs 645 lines Cr 2277 lines Na Mg+ Note slight differences in energy due to magnetic fields caused by spin
C) Desire narrow lines for accurate identification Broadened by i. uncertainty principle Uncertainty principal: Dt .DE ≥h \ Dt .Dn≥1 Dt – minimum time for measurement Dn – minimal detectable frequency difference Peak line-width is defined as width in wavelength at half the signal intensity
C) Desire narrow lines for accurate identification Broadened by ii. Doppler effect Doppler effect - emitted or absorbed wavelength changes as a result of atom movement relative to detector - wavelength decrease if motion toward receiver - wavelength increases if motion away from receiver Usage in measurement of velocity of galaxies, age of universe and big bang theory
C) Desire narrow lines for accurate identification Broadened by iii. Pressure broadening Pressure broadening: Collisions with atoms/molecules transfers small quantities of vibrational energy (heat) - ill-defined ground state energy Effect worse at high pressures: • For high pressure Xe lamps (>10,000 torr) turns lines into continua!
D) Effect of Temperature on Atomic Spectra - temperature changes number of atoms in ground and excited states - need good temperature control Boltzmann equation N1 and No – are the number of atoms in excited and ground states k – Boltzmann constant (1.28x10⁻²³ J/K) T – temperature DE – energy difference between ground and excited states P1 and Po – number of states having equal energy at each quantum level Na atoms at 2500 K, only 0.02 % atoms in first excited state! Less important in absorption measurements - 99.98 % atoms in ground state!
E) Sample Atomization – expose sample to flame or high-temperature • Need to break sample into atoms to observe atomic spectra ii. Basic steps: a) nebulization – solution sample, get into fine droplets by spraying thru thin nozzle or passing over vibrating crystal. b) desolvation - heat droplets to evaporate off solvent just leaving analyte and other matrix compounds c) volatilization – convert solid analyte/matrix particles into gas phase d) dissociation – break-up molecules in gas phase into atoms. e) ionization – cause the atoms to become charged f) excitation – with light, heat, etc. for spectra measurement.
E) Sample Atomization – expose sample to flame or high-temperature iii. Types of Nebulizers and Atomizers
F) Atomic Absorption Spectroscopy (AAS) –commonly used for elemental analysis – expose sample to flame or high-temperature – characteristics of flame impact use of atomic absorption spectroscopy Flame AAS: •simplest atomization of gas/solution/solid • laminar flow burner - stable "sheet" of flame •flame atomization best for reproducibility (precision) (<1%) • relatively insensitive - incomplete volatilization, short time in flame
Different mixes and flow rates give different temperature profile in flame - gives different degrees of excitation of compounds in path of light source
ii. Types of Flame/Flame Structure – selection of correct flame region is important for optimal performance a)primary combustion zone – blue inner cone (blue due to emission from C2, CH & other radicals) - not in thermal equilibrium and not used b) interconal region - region of highest temperature (rich in free atoms) - often used in spectroscopy - can be narrower in some flames (hydrocarbon) tall in others (acetylene) c) outer cone - cooler region - rich in O2 (due to surrounding air) - gives metal oxide formation Temperature varies across flame – need to focus on correct part of flame Primary region for spectroscopy Not in thermal equilibrium and not used for spectroscopy Flame profile: depends on type of fuel and oxidant and mixture ration
Most sensitive part of flame for AAS varies with analyte Consequences: - Sensitivity varies with element - must maximize burner position - makes multi-element detection difficult
iii. Basic instrument design (Flame atomizer) Single beam Double beam
a)atomizer 1)Laminar Flow Burner - adjust fuel/oxidant mixture for optimum excitation of desired compounds - usually 1:1 fuel/oxidant mix but some metals forming oxides use increase fuel mix - different mixes give different temperatures. Laminar – non-turbulent streamline flow • sample, oxidant and fuel are mixed • only finest solution droplets reach burner • most of sample collects in waste • provides quite flame and a long path length
2)Electrothermal (L’vov or Graphite furnace) - place sample drop on platform inside tube - heat tube by applying current, resistance to current creates heat - heat volatilizes sample, atomizers, etc. inside tube - pass light through to measure absorbance Po P Place sample droplet on platform
3)Comparison of atomizers • a) Electrothermal (L’vov or Graphite furnace) : • advantages: • - all sample used • - longer time of sample in light beam • lower limit of detection (LOD) • can use less sample (0.5 – 10) • disadvantage: • - slow (can be several minutes per element or sample) • - not as precise as flame (5-10% vs. 1%) • - low dynamic range (< 102, range of detectable signal intensity) • \ use only when there is a need for better limit of detection or have less sample than Laminar flow can use b) Laminar Flow Burner advantages: - good b (5-10 cm) - good reproducibility disadvantages: - not sample efficient (90-99% sample loss before flame) - small amount of time that sample is in light path (~10-4 s) - needs lots of sample
b)Light source - need light source with a narrow bandwidth for light output - AA lines are remarkably narrow (0.002 to 0.005 nm) - separate light source and filter is used for each element • problem with using typical UV/Vis continuous light source - have right l, but also lots of others (non-monochromatic light) - hard to see decrease in signal when atoms absorb in a small bandwidth - only small decrease in total signal area - with large amount of elements bad sensitivity
2) Solution is to use light source that has line emission in range of interest - laser – but hard to match with element line of interest - hollow cathode lamp (HCL) is common choice Hollow Cathode Lamp Coated with element to be analyzed Process: use element to detect element 1. ionizes inert gas to high potential (300V) Ar Ar+ + e- 2. Ar+ go to “-” cathode & hit surfaces 3. As Ar+ ions hit cathode, some of deposited element is excited and dislodged into gas phase (sputtering) 4. excited element relaxes to ground state and emits characteristic radiation - advantage: sharp lines specific for element of interest - disadvantage: can be expensive, need to use different lamp for each element tested.
c)Source Modulation (spectral interference due to flame) - problem with working with flame in AA is that light from flame and light source both reach detector - measure small signal from large background - need to subtract out flames to get only light source signal (P/Po) i. done by chopping signal: ii. or modulating P from lamp: Flame + P Flame only P Flame + P Flame only time
d)Corrections For Spectral Interferences Due to Matrix - molecular species may be present in flame - problem if absorbance spectra overlap since molecular spectrum is much broader with a greater net absorbance - need way of subtracting these factors out
Methods for Correction 1) Two-line method - monitor absorbance at two l close together >one line from sample one from light source > second l from impurity in HCL cathode, Ne or Ar gas in HCL, etc - second l must not be absorbed by analyte > absorbed by molecular species, since spectrum much broader - A & e are ~ constant if two l close - comparing Al1, Al2 allows correction for absorbance for molecular species Al1 (atom&molecule) – Al2 (molecule) = A (atom) Problem: Difficult to get useful second l with desired characteristics
2) Continuous source method - alternatively place light from HCL or a continuous source D2 lamp thru flame - HCL absorbance of atoms + molecules - D2 absorbance of molecules advantage: -available in most instruments • easy to do disadvantage: • difficult to perfectly match lamps (can give + or – errors)
3) Zeeman Effect - placing gaseous atoms in magnetic field causes non-random orientation of atoms - not apparent for molecules - splitting of electronic energy levels occurs (~ 0.01 nm) - sum of split absorbance lines original line - only absorb light with same orientation - can use Zeeman effect to remove background > place flame polarized light through sample in magnetic field get absorbance (atom+molecule) or absorbance (molecule) depending on how light is polarized Background z z * * * Background+Absorbance * z z
e)Chemical Interference - more common than spectral interference 1) Formation of Compounds of Low Volatility - Anions + Cations Salt Ca2+ +SO42- CaSO4 (s) - Decreases the amount of analyte atomized decreases the absorbance signal - Avoid by: >increase temperature of flame (increase atom production) >add “releasing agents” – other items that bind to interfering ions eg. For Ca2+ detection add Sr2+ Sr2+ + SO42- SrSO4 (s) increases Ca atoms and Ca absorbance > add “protecting agents” – bind to analyte but are volatile eg. For Ca2+ detection add EDTA4- Ca2+ + EDTA4- CaEDTA2- Ca atoms 2) Formation of Oxides/Hydroxides M + O »MO M + 2OH » M(OH)2 - M is analyte - Avoid by: > increase temperature of flame (increase atom production) > use less oxidant non-volatile & intense molecular absorbance A
3) Ionization M »M+ + e- - M is analyte - Avoid by: >lower temperature > add ionization suppressor – creates high concentration of e- suppresses M+ by shifting equilibrium.
G) Atomic Emission Spectroscopy (AES) – similar to AA with flame now being used for atomization and excitation of the sample for light production 1)Atomic Processes heat Degree of Excitation Depends on Boltzmann Distribution: N1 and No – are the number of atoms in excited and ground states k – Boltzmann constant (1.28x10⁻²³ J/K) T – temperature DE – energy difference between ground and excited states P1 and Po – number of states having equal energy at each quantum level Increase Temperature increase in N1/No (more excited atoms) \ I (emission) µN1, so signal increases with increase in temperature
Need good temperature control to get reproducible signal eg. For Na, temperature difference of 10o 2500 2510 results in a 4% change in N1/No Temperature Dependence Comparison between AA and AES: - AA is relatively temperature independent. Need heat only to get atoms, not atoms in excited state. - AA looks at ~ 99.98% of atoms - AES uses only small fraction (0.02%) of excited atoms 2)Comparison of AA and AES Applications AES - emission from multiple species simultaneously Comparison of Detection Limit Some better by AA others better by AES
3) Instrumentation - Similar to AA, but no need for external light source (HCL) or chopper > look at light from flame > flame acts as sample cell & light source Atomization Sources: Electrothermal usually not used – too slow and not as precise
a) Flame Source: - used mostly for alkali metals >easily excited even at low temperatures - Na, K - need internal standard (Cs usually) to correct for variations flame Advantages - cheap Disadvantage - not high enough temperature to extend to many other elements
b) Plasma (inductively coupled plasma - ICP) - plasma – electrically conducting gaseous mixture (cations & electrons) - temperature much higher than flame - possibility of doing multiple element analysis >40-50 elements in 5 minutes Advantages - uniform response - multi-element analysis, rapid - precision & accuracy (0.3 – 3%) - few inter-element interferences - can use with gas, liquid or solids sample
Inductively Coupled Plasma (ICP) Emission Spectroscopy - involves use of high temperature plasma for sample atomization/excitation - higher fraction of atoms exist in the excited state, giving rise to an increase in emission signal and allowing more types of atoms to be detected Ions forced to flow in closed path, Resistance to flow causes heating Temperature Regions in Plasma Torch Magnetic field Ar charges by Tesla coil (high voltages at high frequency)
Overall Design for ICP Emission Spectrometer Rowland circle: - curvature corresponds to focal curve of the concave grating. -frequencies are separated by grating and focused onto slits/photomultiplier tubes positioned around the Rowland circle -slits are configures to transmit lines for a specific element
Arc & Spark Emission Spectroscopy - involves use of electrical discharge to give high temperature environment - higher fraction of atoms exist in the excited state, giving rise to an increase in emission signal and allowing more types of atoms to be detected - can be used for solids, liquids or gas phase samples - types of discharge used: DC arc: high sensitivity, poor precision DC spark: intermediate sensitivity and precision AC spark: low sensitivity, high precision Because of difficulty in reproducing the arc/spark conditions, all elements of interest are measured simultaneously by use of appropriate detection scheme. Arc created by electrodes separated by a few mm, with an applied current of 1-30 A Concave grating disperse frequencies, photographic film records spectra
Comparison of ICP and Arc/Spark Emission Spectroscopy - Arc/Spark first instrument used widely for analysis - all capable of multielement detection with appropriate instrument design (e.g. 40-50 elements in 5 min for ICP - ICP tends to have better precision and stability than spark or arc methods - ICP have lower limits of detection than spark or arc methods - ICP instruments are more expensive than spark or arc instruments
Example 11: For Na atoms and Mg+ ions, compare the ratios of the number of particles in the 3p excited state to the number in the ground state in a natural gas-air flame (2100K)