Download
1 / 17
180 likes | 332 Vues
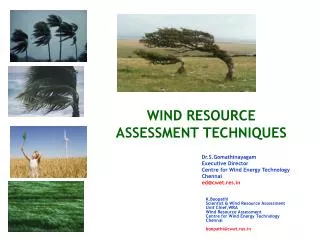
Better Wind Resource Estimation through Detailed Forest Characterization. Jens Madsen & Adrien Corre Vattenfall R&D. EWEA 2011 (Session: Siting Challenges) Bruxelles, March 14.17, 2011. >50% Forest Dairy farming Meadows / pastures Tundra Intensive farming.

E N D
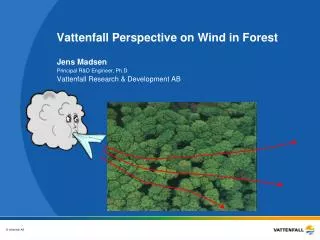
Better Wind Resource Estimation through Detailed Forest Characterization Jens Madsen & Adrien Corre Vattenfall R&D EWEA 2011 (Session: Siting Challenges) Bruxelles, March 14.17, 2011
>50% Forest Dairy farming Meadows / pastures Tundra Intensive farming Locating Wind Farms in Forested Areas … What is the problem? • Forests induce high wind shear and turbulence • Reasonable wind speeds only at higher hub heights So, build somewhere else then … • Sweden has 60-65% forest coverage • Onshore projects in/near forested areas is the rule rather than the exception 2 | EWEA 2011 | Jens Madsen | March 2011
CFD and Forest Flows • CFD as a Wind Resource Assessment Tool • Overcomes shortcomings of linearized flow models … including forested areas • Technical Risk Mitigation: Mapping of severe conditions (turbulence, shear, inflow angle) • Economical Risk Mitigation: Potential to significantly reduce wind resource uncertainty • CFD approach to Forest Canopy Modeling • Canopy represented by porous zone: drag resistance & turbulence modulation • Applies first principles 3 | EWEA 2011 | Jens Madsen | March 2011
CFD Forest Canopy Model (by Katul et al.) • Inside a forest canopy, (z<H) momentum sinks are applied • This drag resistance depends on Leaf Area Density (LAD or α) [m2/m3] • Leaf Area Index(LAI) is the corresponding integral forest density [-] G.Katul et al. : ”One- and Two-Equation Models for Canopy Turbulence” Boundary-Layer Meteorology, Vol.113, pp.81-109, 2004 4 | EWEA 2011 | Jens Madsen | March 2011
Model Parameter Sensitivity – Uniform Forest, Flat Terrain • Preliminary sanity check using 2D model • LAD profiles mostly impact wind speeds within canopy • Correct tree height H is much more important than forest density • In particular true at typical hub heights • Highest sensitivity to model parameters occur near step changes in height and density (forest edges, clearings) 5 | EWEA 2011 | Jens Madsen | March 2011
Model Validation – Risø/DTU Forest Edge Experiments MM-1 MM-2 6 | EWEA 2011 | Jens Madsen | March 2011
Risø/DTU Forest Edge Experiments LAD data backed out from CFD (courtesy of Andrey Sogachev) Seasonal variation in forest density 7 | EWEA 2011 | Jens Madsen | March 2011
Model Validation – MM-2 (inside forest) • Canopy models are sufficiently good … • … considering the poor parameters we feed into them (GIGO principle applies) • Implement advanced forest characterization techniques • The idealized, homogeneous forest does not exist • Spatial distribution of forest height (and density) • What is the impact of a considering a more realistic, heterogeneous forest layout? 8 | EWEA 2011 | Jens Madsen | March 2011
Forest Characterization – Classical approaches Spatial Layout • Classification from satellite/aerial images • Forest perimeters identified • Digitized vegetation map Tree Height • Assessed through site inspection • Extensive lumping is necessary 9 | EWEA 2011 | Jens Madsen | March 2011
Z LAD Forest Characterization – Canopy density (LAD/LAI) hemispherical photography • Direct methods: • Foliage samples, destructive testing • Indirect methods: • Measure Fraction of transmitted radiance • Hemispherical image analysis (LAI) Tedious methods! Limited point-wise sampling Calibration of density level 10 | EWEA 2011 | Jens Madsen | March 2011
LIDAR Airborne Forest Imaging (cont’d) • Technology used in Forest Inventory Management • Laser beam is reflected either by vegetation or ground • Scans 500-800 meter wide section per flight leg • <10 cm accuracy (depending on flight height) • Data acquired (resolutions up tp 1x1 m2) • Digital Terrain Model (DTM) • Digital forest model • Spatial variation of tree heights and density profiles inferred from point cloud percentile values, e.g. zP-90, zP-75, zP-50, and zP-25 11 | EWEA 2011 | Jens Madsen | March 2011
Int. Time LIDAR Airborne Forest Imaging 12 | EWEA 2011 | Jens Madsen | March 2011
LIDAR Point Sky Rendering (colors by veg.height) 13 | EWEA 2011 | Jens Madsen | March 2011
Detailed forest layout: wind speed distribution Forest Layout Wind Speed @ 10m agl. Lake with associated speed-up 14 | EWEA 2011 | Jens Madsen | March 2011
Detailed forest layout: CFD vs. met mast data • Use of detailed forest layouts yield good agreement between CFD and on-site measurements for this Vattenfall site in Southern Sweden • Instrumented telecom mast (93m) and LIDAR campaign (Vestas) 15 | EWEA 2011 | Jens Madsen | March 2011
Conclusions • General on wind power in forest • Forested areas are problematic but inevitable sites (in some geographies) • Extensive measurement campaigns (tall masts, SODAR and/or LIDAR) • Use taller hub heights than you would normally do • Wind resource assessment in forested areas • The CFD canopy models perform well • Detailed forest characterization provides more accurate results than modeling based on idealized, homogeneous forest • Correct tree height distribution is the key information (canopy density, less so) • Beware of information overkill. • Investigate trade-off between forest data resolution and accuracy 16 | EWEA 2011 | Jens Madsen | March 2011
Thanks for your attention Made possible throguh the collaboration with: Risø/DTU, Vestas Technology R&D, and ETS Montreal 17 | EWEA 2011 | Jens Madsen | March 2011