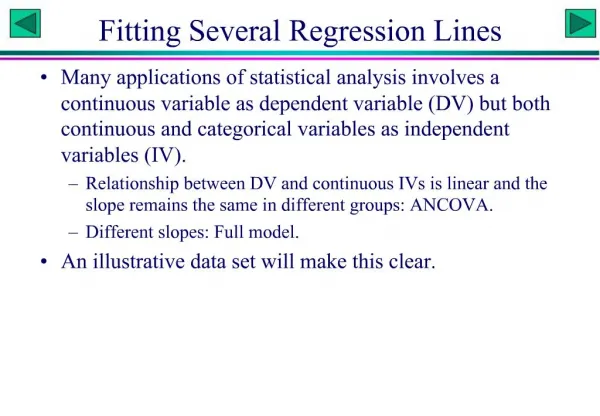
Regression Lines
Regression Lines. Today’s Aim: To learn the method for calculating the most accurate Line of Best Fit for a set of data. Make a Scatterplot of the following data:. Lets guess where the Line of Best Fit should go.

Regression Lines
E N D
Presentation Transcript
Today’s Aim:To learn the method for calculating the most accurate Line of Best Fit for a set of data
Now we want to measure the distance between the actual Y values for each point and the predicted Y value on our possible Line of Best Fit
We can also measure with numbers the vertical distances between the Scatterplot points and the Line of Best Fit
Actual y values: Predicted y values: Difference in y values: 90 1.8 88.2 81 80 90 79.1 .9 3.6 1.8 1.8 83.6 6.3 88.2 3.6 83.6 .9 3.6 81 .9 80 79.1
For the first possible Line of Best Fit, the sum of the vertical distances (errors) was 6.3
90 4.8 4.8 85.2 8.2 3 83 .4 3 81 79.6 .4 80
The sum of the vertical distances (errors) on the second possible line was 8.2.
A Regression Line is the line that makes the sum of the squares of the vertical distances (errors) of the data points from the line as small as possible.
To Calculate the Error: Error = actualy value - predictedy value Note: If the predicted value is larger than the actual value, the error will be a negative number. This is why we square the errors - to turn them into positive numbers.
For example… SUM: 6.35 SUM: .78