NormSTAD Flight Analysis Tool
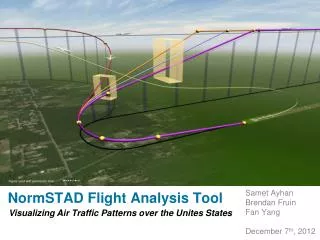
NormSTAD Flight Analysis Tool. Figure used with permission from. Visualizing Air Traffic Patterns over the Unites States. Samet Ayhan Brendan Fruin Fan Yang December 7 th , 2012. Agenda. Introduction Data Demo Evaluation Future Work Conclusion.

NormSTAD Flight Analysis Tool
E N D
Presentation Transcript
NormSTAD Flight Analysis Tool Figure used with permission from Visualizing Air Traffic Patterns over the Unites States Samet Ayhan Brendan Fruin Fan Yang December 7th, 2012
Agenda • Introduction • Data • Demo • Evaluation • Future Work • Conclusion
Introduction – What is the problem? • National Airspace System (NAS) • A complex non-deterministic system • Impacted continually by major/minor variables • Weather • Human decisions • Even an insignificant event such as delay in obtaining a wheel chair for a passenger with disability • Accurate delay forecasts are unavailable • Slots for arrival and departure are missed and reassigned • Constantly, decisions are being made to recover the system • Keep it as close to optimal, given its current state • No method available • Quantifying the effects of a decision or • Comparing them to an alternate decision • Wasted fuel, and time resulting in less greener skies, loss of resources
Introduction – How does NormSTAD solve? • NormSTAD, a web-based tool • Interactively visualize flight data • Overlay flights with varying time series, • Detect • Outliers / anomalies • Holding, slow-down, and speed-up patterns • Discover • Progress of a flight with respect to others • Ascend and descend patterns • Initiate an effort to further analyze • Rectify the causes • Save money and time • Consume less fuel, have greener skies • Manage air traffic more efficiently • Stands for Normalized Speed, Time, Altitude, and Distance
Data – ASDI • Aircraft Situation Display to Industry (ASDI) • Near real-time air traffic data • Provided by the FAA • Position and flight plan • Basic attributes • Latitude, • Longitude, • Altitude, • Airspeed, • Departure/arrival airport, • Flight number • Sampled down (~1/6) for efficiency
Evaluation • Niche subject matter (ATM) • Used Expert Reviews and Questionnaire • Three subject matter experts (SME) • One from academia • Two from industry (Retired ATCs) • Provided with walkthrough/tutorial – 20 minutes • Questionnaire with six sections – 20 minutes • 3 specific tasks to complete – 15 minutes
Evaluation • Questionnaire with six sections – 20 minutes • Overall reaction System capabilities • Screen Terminology • Learning Open-ended comments
Evaluation • Retired AT Controller commented: • “Hmm, this flight has such a fluctuating vertical flight path!” • You should demonstrate this to the FAA. They would benefit from using it!” • Academician commented: • “Very easy to use” • “A novel way of looking at flights” • Changes per improvement suggestion: • Only summary info displayed in Details on Demand table • Revised the terminology • Enabled multi-select in line chart • Added legend to the line chart
Future Work • Display all data points • Currently only show sampled data due to implementation constraints • Show airport surface data • We only have en-route data available for NormSTAD, but would like to extend to include airport surface data
Conclusion • NormSTAD is a tool that can be used to quickly spot outliers in an easy to use visualization • As seen in demonstration • Outliers or interesting flights can then be further analyzed by other tools • This can result in savings of time and money as a result of an increase in efficiency and fuel consumption is decreased
Special Thanks to • Professor Ben Shneiderman • Professor Michael Ball • Subject Matter Experts • Peer Reviewers
Discussion Questions?