Graphical Policy Analysis Tool
The Graphical Policy Analysis Tool (GPAT), developed by Kevin Wheeler for USBR and CADSWES, facilitates the comparison of complex hydrologic policies using multiple analytical slots of interest. It allows stakeholders to analyze and visualize policy impacts over time, addressing common questions about probabilities and statistical comparisons of hydrologic scenarios. With an interactive design, GPAT promotes stakeholder discussions and enables model managers to extract and present significant results effectively. The tool enhances understanding of trade-offs between policies and generates new policy ideas through iterative collaboration.

Graphical Policy Analysis Tool
E N D
Presentation Transcript
GPAT Graphical Policy Analysis Tool Developed by Kevin Wheeler for USBR and CADSWES
Comparing Potential Policies Complex Models = Complex Output • Multiple Slots of Interest • Stakeholders • Multiple Run Analysis • Hydrologic scenarios • Multiple Policies of Interest • Time Four Dimensional Space
Traditional Comparison • Model managers extract, graph and present all results that they deem as significant – Potential bias? • Focus on differences and not similarities • Stakeholder inevitably ask questions for which the modelers are not prepared to answer • Discussions Cease • RESCHEDULE MEETINGS = $$$
Using ExcelWriter • Write RiverWare Outputs into Spreadsheet Format Slot Run POLICY #1 Time
How to Compare Policies??? POLICY #2 POLICY #1 POLICY #3 POLICY #5 POLICY #4
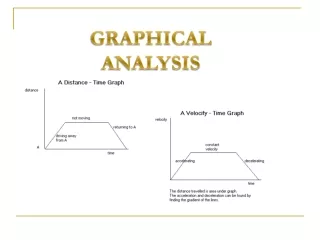
Commonly Asked Questions • I want to compare individual slot values over time for a common hydrology
Commonly Asked Questions • I want to compare the statistics of all hydrologic scenarios over time • Mean, Minimum, Maximum, Standard Deviation
Commonly Asked Questions • How do the probabilistic distributions of slot values compare at one point in time? PDF (Histogram) , CDF
Commonly Asked Questions • What will the slot values be over time that correspond to a particular percentile of occurrence?
Commonly Asked QuestionsProbabilities • What is the probability of a slot variable exceeding or not exceeding a certain value through time? • What is the probability of a slot variable falling within a specified range through time? • What is the probability of a binary occurrence? • Flood release, shortage, surplus, equalization flags
Specialty Functions • Arithmetic operations between slots in the same policy to create new slots • What is the total storage capacity in the system? • Arithmetic operations between different policies • What are the differences between two policies for ALL slots? • Isolate Monthly Values • What is the probability exceeding a slot value during a specific set of months? • Record and recall graphs produced
Benefits • Give rapid access to all model results • Answer questions “on the fly” • Facilitate model interpretation by stakeholders • Generate a qualitative AND quantitative understanding of similarities and tradeoffs • Promote interactive discussions between stakeholders – Generate new policies
Present • Version 1.1 on the web site • Version 1.2 Development circulating
Future • Bulletproof development version and release • Solicit needs • Include some concepts from TVA’s tool • Additional timesteps • Connections to other tools • and more! • Add features to version 2.0