SlideServe
Menu
Préférences
© SlideServe · v2026

Kinematics through Graphical Analysis

lovej avatar
15 diapositives · 272 Views · Jan 05, 2020

Learn how velocity, acceleration, and displacement can be interpreted from graphs. Discover how slopes and areas help in motion analysis.
Kinematics through Graphical Analysis - slide 1
01 / 15Kinematics through Graphical Analysis
1 / 17

Télécharger la présentation

Kinematics through Graphical Analysis
Une image / un lien ci-dessous est fourni (tel quel) pour télécharger la présentation

Politique de téléchargement : le contenu du site vous est fourni TEL QUEL pour votre information et votre usage personnel ; il ne peut être vendu, concédé sous licence ni partagé sur d’autres sites sans l’accord de son auteur.Le contenu vous est fourni TEL QUEL, pour votre information et votre usage personnel uniquement. Téléchargez la présentation en cliquant sur ce lien. Lors du téléchargement, si vous ne parvenez pas à télécharger une présentation, l’éditeur a peut-être supprimé le fichier de son serveur.Pendant le téléchargement, si vous ne parvenez pas à obtenir une présentation, le fichier a peut-être été supprimé par l’éditeur.

F I N

Plus de contenu associé

Transcription de la présentation
  1. Graphical Analysis

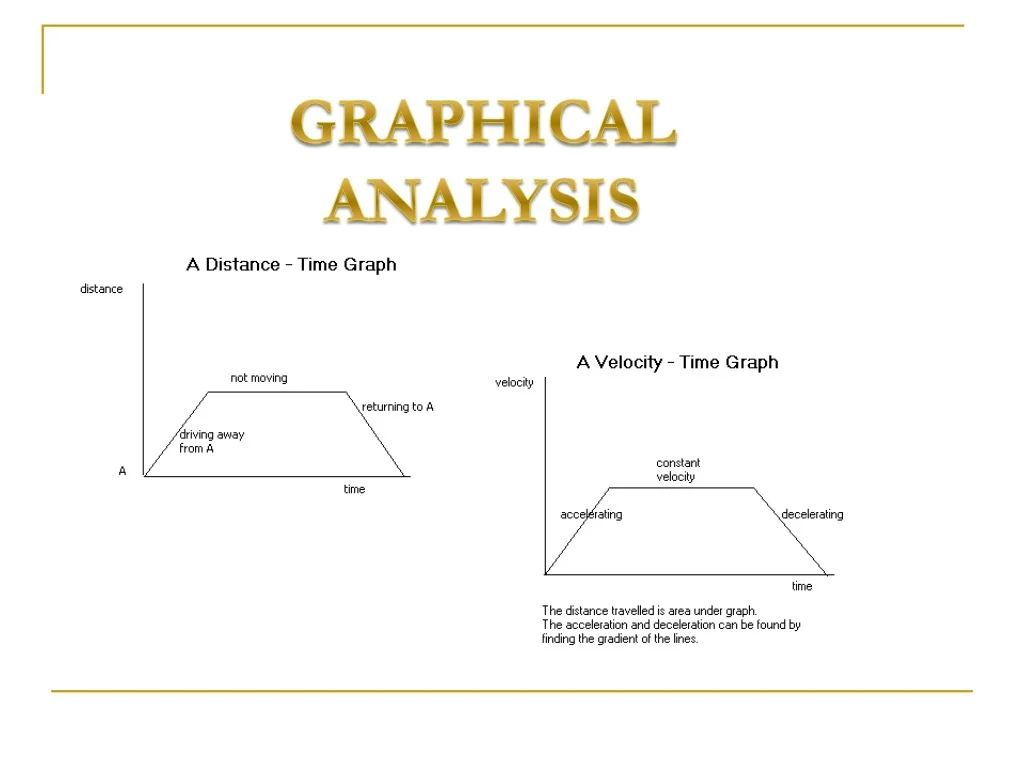
  2. Let’s Review VELOCITY is the SLOPE of a distance, position, or displacement vs. time graph.

  3. Let’s Review What is the slope doing? INCREASING What is the velocity doing? INCREASING

  4. Let’s Review

  5. Let’s Review Describe the acceleration during interval A. The acceleration or SLOPE is constant and positive. Describe the acceleration during interval B. The acceleration or SLOPE is ZERO. Describe the acceleration during interval C. The acceleration or SLOPE is constant and negative.

  6. Let’s Review What is the acceleration(slope) doing? The acceleration is INCREASING!

  7. Let’s Review The slopes help us sketch the motion of other graphs!

  8. NEW MODEL = AREA

  9. The Area Model How FAR did this object travel during interval A? How FAR did this object travel during interval B? How FAR did this object travel during interval c?

  10. The Area Model

  11. The Area Model What is the change in Velocity during the t=2 to t=4 interval? Dv

  12. In summary v (m/s) a (m/s/s) slope = v x (m) slope = a area = v area = x t (s) t (s) t (s)

  13. Comparing and Sketching graphs One of the more difficult applications of graphs in physics is when given a certain type of graph and asked to draw a different type of graph List 2 adjectives to describe the SLOPE or VELOCITY The slope is CONSTANT slope = v x (m) The slope is POSITIVE t (s) v (m/s) How could you translate what the SLOPE is doing on the graph ABOVE to the Y axis on the graph to the right? t (s)

  14. Example v (m/s) x (m) t (s) t (s) 1st line 2nd line The slope is constant The slope is “0” The slope is “-” 3rd line The slope is “+” The slope is constant

  15. Example – Graph Matching What is the SLOPE(a) doing? a (m/s/s) The slope is increasing v (m/s) t (s) a (m/s/s) t (s) a (m/s/s) t (s) t (s)