Graphical Analysis of Data
Graphical Analysis of Data. Details on website http://sst.tees.ac.uk/external/U0000504 select “Res/Sci” method on main menu. Graphical Analysis. Pictorial representation of a mathematical relationship Two main approaches Analytical Based on theory Empirical


Graphical Analysis of Data
E N D
Presentation Transcript
Graphical Analysis of Data Details on website http://sst.tees.ac.uk/external/U0000504 select “Res/Sci” method on main menu
Graphical Analysis • Pictorial representation of a mathematical relationship • Two main approaches • Analytical • Based on theory • Empirical • Based on observation and experience
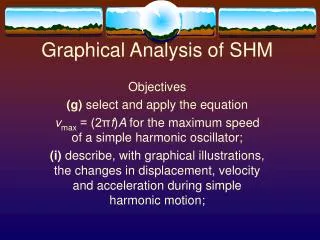
The straight line (1) • Most graphs based on numerical data are curves. • The straight line is a special case • Data is often manipulated to yield straight line graphs as the straight line is relatively easy to analyse
The Straight line (2) • Straight line equation • y = mx + c • Intercept = c • slope = m
Linearisation (1) • Many functions can be manipulated mathematically to yield a straight line equation. • Some examples are given in the next few slides
Polynomials • These are functions of general formula • y = a + bx + cx2 + dx3 + … • They cannot be linearised • Techniques for fitting polynomials exist • for example using Excel
Functions involving logs (1) • Some functions can be linearised by taking logs • These are • y = A xn and • y = A ekx
Functions involving logs (2) • For y = Axn, taking logs gives • log y = log a + n log x • A graph of log y vs. log x gives a straight line, slope n and intercept log A. • To find A you must take antilogs (= 10x)
Functions involving logs (3) • For y = Aekx, we must use natural logs • ln y = ln A + kx • This gives a straight line slope k and intercept ln A • To find A we must take antilogs (= ex)
Special Graph Paper (1) • It is possible to plot graphs of y=Axn and y=Aekx without taking logs • This involves the use of graph paper in which the scale has been adjusted to give the intervals for logs. • The next two slides give examples
Special Graph paper (2) • Log - Log graph paper for y = Axn • Slope = n = • The intercept is at • log x = 0 i.e. the value of y at x = 1.0
Special Graph Paper (3) • Log-linear graph paper for y = Aekx • Take logs to base 10 • log y = log A + kx.log10e • Intercept = A • Slope =k log10e
Using a spreadsheet • Excel has tools to fit lines • Lines can be fitted on the graph • Slope and gradient can be found from data in tabular form • For more details see website
Finish For now ...