Download

1 / 15
150 likes | 291 Vues
In Chapter 2, explore the essential techniques for organizing raw data into meaningful frequency distributions and graphical displays. Learn how to construct frequency tables, understand the types of distributions—categorical and grouped—and apply the correct formulas for calculating percentages and grand totals. This chapter outlines how to categorize and display data effectively to draw insights and facilitate comparisons. With practical examples and homework assignments, enhance your skill set in data analysis and visual representation.

E N D
Graphical Descriptions of Data Chapter 2
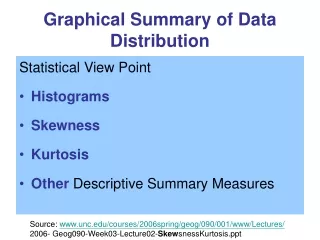
Outline • 2.1 Frequency Distributions • 2.2 Graphical Displays of Data • 2.3 Analyzing Graphs
Introduction • After collecting data as described in Chapter 1, you need to organize it so that inferences and conclusions can be drawn • Raw data is not very meaningful to an audience. • Additionally, in our modern, fast paced society, graphs are useful for quickly providing a wealth of information to an audience.
Section 2.1 Frequency Distributions • Objectives • Determine how to construct a frequency table
What is a Frequency Distribution? • A frequency distribution is the organization of raw data in table form, using classes (groups) and frequencies • Class (group) is a quantitative or qualitative category • Frequency, f, of a class is the number of data values contained in a specific class
Types of Frequency Distributions • Used for data that can be used in specific categories, such as nominal or ordinal level data. • Examples: Political affiliations, religious affiliations, major field of study • Used with quantitative data • Classes (groups) included more than one unit of measurement Categorical Frequency Distribution Grouped Frequency Distribution
Categorical Frequency Distribution • Make a table • Tally the data • Count the tallies • Find percentage of values in each class using the following formula: % = • Find the grand totals for frequency & percent
Grouped Frequency Distribution • Definitions • Lower Class Limit (LCL) is the smallest data value that can be included in the class • Upper Class Limit (UCL) is the largest data value that can be included in the class • Class Boundaries are used to separate the classes so that there is no gaps in the frequency distribution • Rule of Thumb: Have one additional place value and end in .5 • Find class boundaries by subtracting 0.5 from each LCL and adding 0.5 to each UCL • Class Width is the difference between two consecutive LCL • Find by subtracting LCL2 –LCL1
Grouped Frequency Distribution • We must decide how many classes to use and the width of each class using the following guidelines: • There should be between 5 and 20 classes. • It is preferable, but not absolutely necessary that the class width be an odd number • The classes must be mutually exclusive (nonoverlapping values) • The classes must be continuous (no gaps, even if frequency is 0) • The classes must be exhaustive (use all the data) • The classes must be equal in width
Grouped Frequency Distribution • Decide on the number of classes (given) • Determine the class width (given) • Select a starting point (this is the first LCL) (given) • Determine the LCL by adding the class width to first LCL to determine next LCL, ….. • Determine the UCL by subtracting 1 from second LCL to obtain first UCL, then add class width to determine next UCL….. • Tally the data
Find the numerical frequencies from tallies • Find the grand total of frequency
Example-Construct a frequency distribution of the ages of Cup Drivers. Use 6 classes beginning with a lower class limit of 20 and class width of 10
Reasons for Constructing a Frequency Distribution • To organize data in a meaningful, intelligible way • To enable the reader to determine the nature or shape of the distribution • To facilitate computational procedures for measures of average and spread • To enable us to draw charts and graphs for the presentation of data • To enable the reader to make comparisons among different data sets
HOMEWORK • Page 57 #15-18 (You do not have to identify class boundary, class midpoint, relative frequency, or cumulative frequency!!!) Only two or three column table ---column 1: Class, column 2: tally, column 3: frequency