Download
1 / 125
1.25k likes | 1.39k Vues
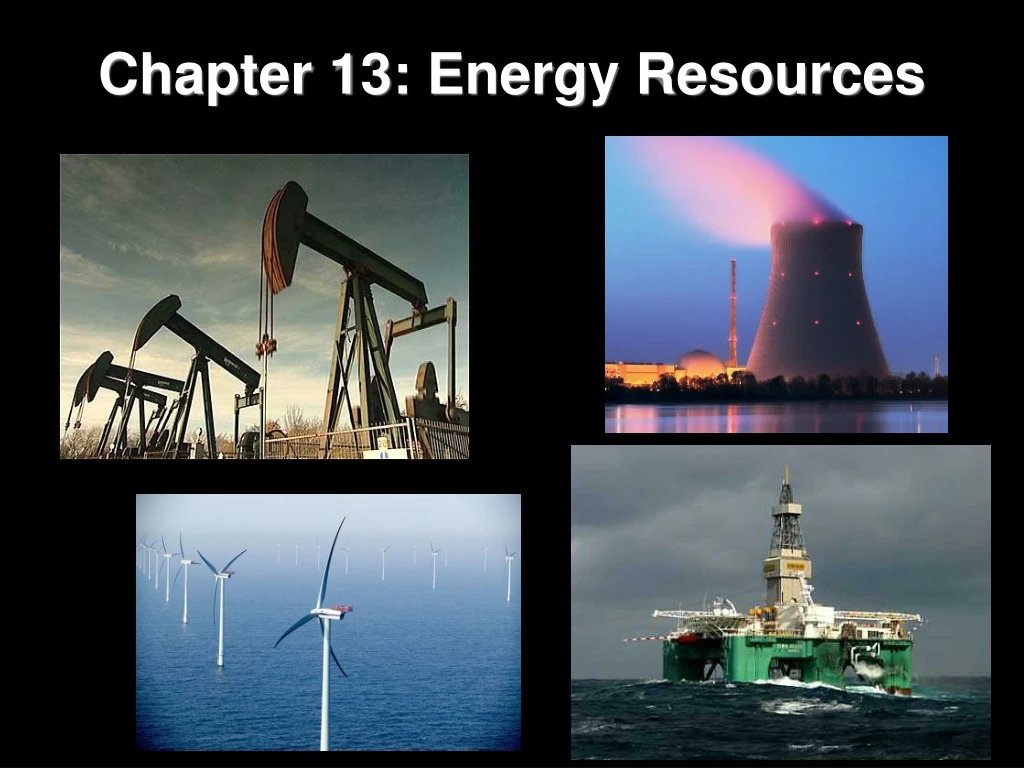
Chapter 13: Energy Resources. Energy - Introduction. U.S. oil consumption ~ 22 million barrels/day Exxon’s, Girassol Field, Angola Hubbard’s “Peak Oil ”; global vs. U.S. production Energy future hydrogen?. Girassol Offshore Field. Girassol field Angola, Africa

E N D
Energy - Introduction • U.S. oil consumption ~ 22 million barrels/day • Exxon’s, Girassol Field, Angola • Hubbard’s “Peak Oil”; global vs. U.S. production • Energy future hydrogen?
Girassol Offshore Field • Girassol field Angola, Africa • Discovered in 1996, Elf Exploration Angola • Offshore, deep water field 4500 ft. deep • ~100 miles offshore
Girassol • Oil hosted in sandstone reservoirs ~3000 ft. below seafloor • Outer edge of Congo River delta organic rich sediment • Produces ~200,000 barrels/day • $2.7 billion development costs • Total reserves est. ~750+ million barrels
M. King Hubbard’s global “peak oil” prediction (1956), predicted U.S. peak between 1965-1970.
Energy Resources Chapter Objectives • Fossil Fuels • Non-fossil fuel energy resources • Environmental considerations; extraction & waste products
I. Fossil Fuels Fossil Fuels hydrocarbon-based energy sources from organic-rich sedimentary deposits • Petroleum, natural gas, coal
I. Fossil Fuels • Hydrocarbons & Petroleum • Simple to complex, H-C based molecules • Table 14.1 • Crude oil (petroleum) is refined (cracking) into various compounds • Gasoline is a product of the refining-cracking process
I. Fossil Fuels B. Geologic Origin of Petroleum • 5 main “steps or conditions” needed • Source rock rich in organics • Heatingto “oil window” needed • ~50-150oC = 100-200oF • 3-5 km = 1-3 miles burial
Geologic origin of petroleum 3. Reservoir rock & fluid migration 4. Caprock needed prevents leakage 5. Geologic trap geologic structures
I. Fossil Fuels C. Oil Production • Exploration • Identify targets via geology • Field surveys 2. Drilling • Vertical vs. slant vs. horizontal (directional) & multilateral
I. Fossil Fuels 3. Pumping
I. Fossil Fuels 4. Secondary Recovery • Extraction of remaining petroleum after standard recovery • Thermal steam injection • Fire flooding air + fire = heat • Water injection (washing) • Miscible light gas mixtures or CO2
I. Fossil Fuels 5. Delivery & Refining • Transport of crude to refineries • Pipelines vs. supertankers • Refining converting petroleum crude into various hydrocabon compounds: Crude refining gasoline, etc….
BP, Gulf Oil Leak Disaster • Deepwater Horizon • Deep water drilling (exploration) ~5000’ • Blow out explosion & fire Apr. 20th, 2011 • Contained/capped July 15th • Officially sealed, Sept. 20th, 2011 • 11 dead
BP, Gulf Oil Leak Disaster • Leak ~35,000-60,000 barrels/day • 2.5 million gallons/day max. est. • Total 4.9 million barrels, 206 million gallons • Where did it all go?
I. Fossil Fuels 6. Price • Market costs OPEC major player in determining world market costs • “supply & demand” since 2003, global demand (vs. supply) increasing significantly….why? • Refinery capacity effects $$$ in U.S.
I. Fossil Fuels 7. Peak Oil? • Reserves that which can be extracted at profit • Global reserves ~1200 bbl’s proven (2005) • Have global reserves peaked?